 Array/Band Analyzer
 Main Menu: View >
Array/Band Analyzer
Shortcut: F7
Toolbar button: ![]()
Use this window to analyze grided arrays, 1D gels, dots and slots or band blots and other basic arrays or whatever kind of images arranged in grids or bands you have.
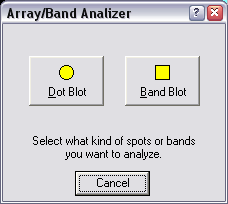
The first step is selecting what kind of array or bands you want to analyze.

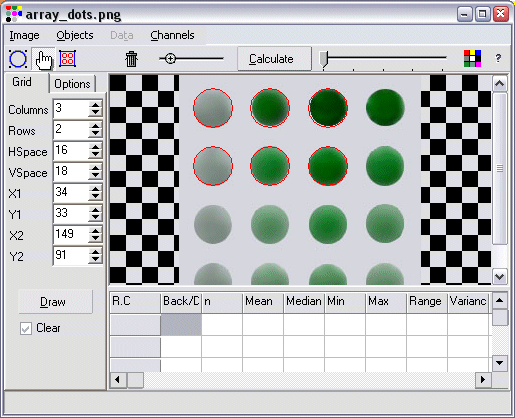
In fact both Dot and Band blots use a fairly similar window:

In case you selected Dot blot, the Analyzer will draw elliptical selection objects, otherwise it draws rectangular ones. The buttons on the Analyzer toolbar change according to the initial blot shape selection.
| Band blot toolbar | |
| Dot blot toolbar | |
Although the Band blot is intended for bands and Dot Blot for arrays, you can use both them interchangeably.
Image Loading
The first step is loading an image or selection into Analyzer window. Several buttons and Menus are going to stay disabled until and an image or selection is loaded by using the Image Menu.
| Image Menu |
Description
|
| Load from selection | Loads the image from the active selection, or if there is no selection, from the active image window. NOTE: Important notice about loading from selections. |
| Load from current image | Loads the image from the active image window. |
| Load from file | Opens an Open file dialog to select the image to be loaded. |
| Opens a Print setup dialog box. | |
| Save as... | Allows saving the pixel profile graph as a Window Bitmap (BMP), Window Metafile (WMF) or Enhanced Window Metafile (EMF) files. |
After loading an image you should define where are the blots in the image, by drawing selection objects manually or by drawing one grid.
|
By default, the Draw Grid button (
If you find difficult to resize the objects, try changing the zoom to 100%. If you delete a full row or column after calculating the statistical data, please set the proper number of rows or columns in the Rows or Columns text fields and click again the Calculate button. Optionally you can draw manually each object using the Add Object ( |
|
|
|
Only the statistical measurements selected in this tab will appear in the spreadsheet. The Dec. Pos. text box sets how many decimals will be shown. After selecting or deselecting items just click on Refresh button to actualize the spreadsheet display. If Percent is selected the Set column or row to use as 100% window will pop-up. More information (below in this same page). Background Subtraction is intended mainly for grayscale images, it is the process by which you set a minimum (or maximum) pixel level (the background color). Only pixels above or below that level will be taken in account when performing the statistical analysis. If Subtract is selected, Back/Dot % option is automatically deselected, because will be no background/dot differences if the background is subtracted. Background subtraction is performed only if the Subtract checkbox is selected. To set the pixel level click Set color button.
The cursor over the image will change to a color picker If Brighter is selected, only pixels with values above the background are going to be included in the calculation; if Darker is selected, only pixels with values below the background color level will be include. If Brighter or Darker check boxes is selected and if Back/Dot % is specified, the Back/Dot % column will show the percentage of background or dot in each blot. When Subtract is selected the objects that are filtered out completely will show 0 values in the spreadsheet and will be filled with the same color used for the object border, to indicate that they were not used. |
If you draw the objects manually or you delete some row or column of objects after they were drawn, take care of correcting the number of columns or rows in the columns and rows text boxes, so they reflect correctly the columns and rows of objects actually drawn on the image.
After calculating the statistical data you can use the Data menu to save or export the data, besides some other options..
| Data Menu |
Description
| |
| Set column or row to use as 100% reference |
Each blot will be assigned a percentage values, relative to the Mean value of the column or row set as 100%. | |
| Adjust pixel values |
Allows inverting pixel values and modifying the pixels range. See Adjust pixel values window. | |
| Save | Saves the data Sheet. In case the data does not have any changes, this menu is disabled. If the data was not previously saved it opens the Save As dialog box. | |
| Save As. | Opens the Save as dialog box, where you can choose the File name to save the data. | |
| Export | CVS file | Saves the Data as a Comma delimited text file with .CSV file extension. Spreadsheets programs, including Excel and statistical programs can read this format. |
| HTML file | Saves the Data as an HTML file with .htm file extension. | |
| ASCII file | Saves the Data as an ASCII (only text) file with .TXT file extension. | |
|
HTML Array Exports one single data column as an HTML page.
If Include images is selected the images of each blot is included in the HTML page (as a .PNG file) In such case both the images and the HTML page are saved in the same folder. If Display is selected, the HTML file will be displayed immediately after saving it, using the internal HTML viewer included with the program. |
||
Other toolbar buttons
The Retardation Factor ![]() button allows
drawing vertical lines. It is shown only if you selected the Band Blot
option.
button allows
drawing vertical lines. It is shown only if you selected the Band Blot
option.
Retardation Factor (Rf) is a measurement of position along the band. The start of the Rf line will be counted as 0 and the end as 1.The Rf for each spot will be its central point. Retardation Factor only is shown when generating a Column Histogram. More information.
The Zoom slider enlarges or reduces the image display.
The Line width ![]() slider sets the line
width of selected object/s and any future object.
slider sets the line
width of selected object/s and any future object.
The Object Color ![]() button opens a Color
dialog box to select the color of selected object/s and any future object.
button opens a Color
dialog box to select the color of selected object/s and any future object.
Other menus
| Objects Menu |
Description
| |
| Select All |
Selects all objects and also the Select button
| |
| Delete | Deletes any selected object/s. | |
| Object Histogram | Opens the Non Adjustable Histogram window to show the selected
object histogram. Click an object on the image or its corresponding cell in the spreadsheet to select which one will be used. | |
| Column Histogram | Opens the Column Histogram
window.(only available if you selected Band blot). Select the column to be shown by clicking on a spreadsheet cell corresponding to any object on that column. | |
| Channels menu |
Sets which image channel will be used to perform the calculations. Use other channels than Grayscale only if the image is a color one. See also Color Channels | |
The conversion factor doesn't influence how Statistics, Pixel Profile or Array/Band Analyzer work. It only affect values written into DataSheet.