Keyboard: Ctrl-G
Toolbar button:
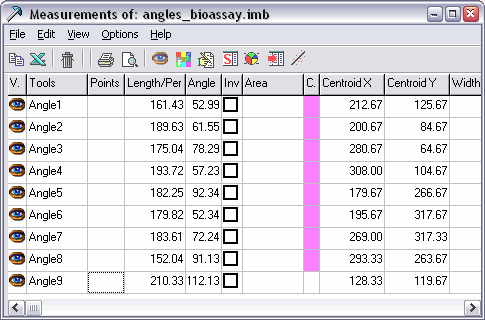
Measurements Window
Main Menu: Measurements
> View/Hide Measurements Window
Keyboard: Ctrl-G
Toolbar button: ![]()
The Measurements Window is where all measurements done with the Measurement Tools are recorded.
Measurements are always recorded in pixels, but its values are displayed adjusted by the current conversion factor.
Each time the image is saved, also the measurements will be are saved along as a measurements file, with the same name than the image, but with .msr file extension.
By way of example, if an image is named wood_m.png, the measurements file will be automatically saved as wood_m.png.msr. If you rename the image outside Bersoft Image Measurement, take care of renaming the measurement file accordingly, otherwise it will not be loaded with the image. If you save the image with another filename with Bersoft Image Measurement, the measurements will be saved along with the proper file name.
If the image was not modified, only the measurements will be saved, therefore a JPEG file may be saved many times without losing quality, provided that only measurements were performed, without actually modifying the image itself.
Each time the image is re-opened also the related measurement file will be loaded, provided than it is kept in the same directory where the image is located.
Each image has its own Measurement window, to join measurements of different images in a single place, they should be sent to the Results Window, see the description for Send Data to Results Window command below to learn more.
The recorded measurements are shown in a datasheet, each measurement in a row:
The ![]() icon that appears on the left of each
row is a button that allows showing or hiding the measurement shown in
that row, the same icon on the toolbar shows or hides all selected measurement
row. Hidden measurements still appear in the measurement window, but they
are not drawn on the image.
icon that appears on the left of each
row is a button that allows showing or hiding the measurement shown in
that row, the same icon on the toolbar shows or hides all selected measurement
row. Hidden measurements still appear in the measurement window, but they
are not drawn on the image.
Alternatively, the View menu allows hiding some measurements in the Measurements windows. This is useful if you don't want to send all measurements to the Results window, nor use all them to draw a chart of get statistics.
The Length/Per column shows either the segment length of the measurement perimeter. In the case of angles, it shows the sum of the length of the three angle sides.
The Inv. column (the 6th one from left to right) is used to invert the angle measurement for the current row (example: 90 turns in 270░). All the other cells simply show the measurement features. Depending on the tool used to perform each measurement some cells may be blank.
The measurements can be edited at any time, also its color and font settings can be modified or they can be deleted from the image if needed.
When a measurement is modified, the values shown by the datasheet will reflect the change automatically. See also: How to modify measurements.
Measurements are numbered sequentially, therefore when one
measurement is deleted the measurements numbering continuity is broken.
In case you want to keep the numbering continuity use the menu command
Measurements
> Clear counting gaps; it will
renumber all measurements and also correct any duplicated numbering.
Learn more.
| Menu/Toolbar Commands |
|
Shortcut |
Description
|
| File Menu |
|
|
|
|
Export as |
|
|
The Export command that can be used to save the measurements as CSV, ASCII or HTML files. Learn more. |
|
|
|
|
Prints the Measurements datasheet. See Print Options |
|
Send Visible Data to |
|
|
The Results Window is meant to consolidate data from more than one image in a single database. When data is sent to the Results Window you will be asked to assign a series number to the data, in that way different measurements can be sorted out in different Series in the Results Window. Only measurements with the |
|
* Statistics |
|
Ctrl-S |
Opens a statistics window
with the statistics for all visible measurements in the Measurements
window. |
|
* Charts |
|
|
Displays different kinds of charts. Before displaying the chart you
should select which feature (length, area, angle, # points, centroid
X, centroid
Y, width or height). |
| Edit Menu |
|
|
|
| Copy |
|
Ctrl-C |
Copies the selected cells to the Windows Clipboard. |
| Paste |
|
Ctrl-V |
Places a copy of cells previously copied to the Windows clipboard into the current cell location. |
| Copy to Excel |
|
|
Starts Excel, creates a Worksheet and copies and pastes the selected cells there. |
|
Select All |
|
Ctrl-A |
Selects all cells. Select the cells with this command before copying them if you want to copy the cells headers along with the data. |
|
Label Move |
|
Ctrl-L |
Opens the Label Move window to move the selected measurement label up, down, right or left. |
|
Font/Color |
|
|
Opens the Set Measurement Color window, which allows to modify the lines, background and font color and the typeface for the selected measurements. |
|
|
|
Opens the Comments window, to add or modify comments to the selected measurements. Comments are only text up to 255 characters long. Clicking the Comments text box in the Left pane also opens this window. | |
|
Delete Selected |
|
Del |
Deletes the selected measurements. |
| * Calculate Menu |
|
|
|
|
* Calculate best-fit line |
|
|
Creates a straight line that best fits the selected counter points on
the current image. After the calculation is done a new Segment will be added to the measurement, with the calculation results appended as comments, as the following lines show. Upper-left origin (as set in Preferences) |
|
|
|
| |
| Show/Hide the selected measurements |
|
|
Shows/hides one or several measurements. |
| Counter Automatic Area Segment Polygon (Per./Area) Angle Rectangular Area Elliptical Area |
|
|
By selecting/deselecting
these menu items you can show or hide all measurements from different
tools.
This is useful if you don't want to send all measurements to the Results window, nor use all them to draw a chart of get statistics. |
| Left Pane |
|
|
The Left Pane shows the measurements individual points/segments coordinates/length and comments. Also it shows the Decimal positions
and the Conversion factor boxes,
which determine how measurements are displayed in the datasheet. |
|
|
|
|
Opens this Help page. |
* This feature only is available in the Professional version. Learn more.
|
Left Pane
|
Description
|
|
Points datasheet |
Shows the coordinates of each point that belongs to the selected measurement (for polygons, segments and angles). In the case of counters or automatic area measurements, it shows the coordinate where you clicked. |
|
Comments |
Shows the comments attached to the selected measurement,
if any. By clicking this text box the comments can be edited. |