 Best-fit lineBest-fit line
We call best-fit line to the line that passes most closely through several coordinates, minimising the distances between the line and the actual points.
The aim now is to identify the function whose curve is the line.
Note: Bersoft Image Measurements only supports lineal functions (straight lines).
Suppose you have some data involving two variables, in the
form of several pairs of values for them. To find about the relationship
between the variables, the first step is to plot the pairs of values as
coordinates of points on a graph, using the ![]() tool.
tool.
Then, click ![]() on the Measurement
window toolbar, so the program calculates the best-fit straight line
and draws it as a new measurement segment on your graph. The line will
pass through or close to as many of the points as possible.
on the Measurement
window toolbar, so the program calculates the best-fit straight line
and draws it as a new measurement segment on your graph. The line will
pass through or close to as many of the points as possible.
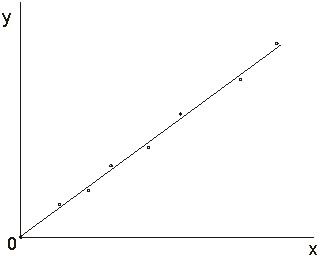
Notice that the best-fit line does not necessarily pass through any of the points plotted.
The calculation results will be appended as comments to the segment drawn to show the best-fit line, and after the calculation is done, an small window showing the measurement comments will be shown.
It is advisable to set the origin of coordinates to the lower-left point in the Preferences window, before using the best-fit line feature, in order to get the proper values.
Results example (as shown in the comments window).:
Lower-left
origin
y = a + x * b
a = 559.499399218985
b = -2.05181736257134
y = 559.499399218985 + x * - 2.05181736257134
r = -0.97296016350337
Two-variable Statistics and Linear Regression
Two variable statistics make possible the development of a relationship (correlation) between two sets of data. Each pair of data has x and y values. From these sets of data a line of regression can be established. The relationship of the two sets of data by use of the straight line method is called Linear Regression. In Linear Regression there are three important values, r, a, and b.
The equation of the straight line is y = a + bx, where a is the point at which the line crosses the Y-axis and b is the slope of the line.
The correlation coefficient r shows the relationship between two sets of data. A perfect correlation between two values is an r equal to 1 (-1 is a perfect negative correlation); in other words, by knowing the value of one variable you can predict with 100% accuracy the value of the other variable. The further the value of r is from 1, the less reliable will your predictions be. The following table can be used as a set of definitions of the values of the correlation coefficient:
|
|
Value of r | Call it |
|
Positive |
+0.80 to +1.00 |
Extra High |
|
|
-0.20 to +0.20 |
Nil |
|
Negative |
-0.20 to -0.40 |
Low |