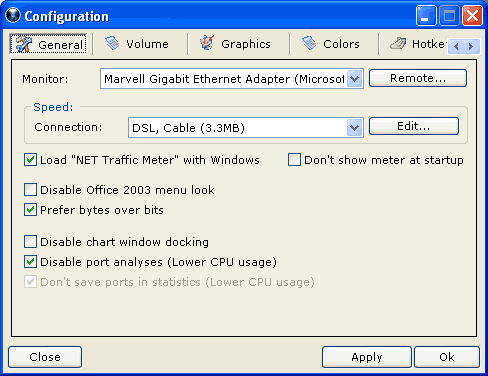
Before NET Traffic Meter will work properly, you need to verify the settings of your network or modem interface. Select the interface you wish to monitor from the "Monitor" list.
This interface is highly experimental and not recomended. You can see more information about it here.
By default the "Automatic" setting is used as profile. This will adjust the speed setting to the maximum data rate that is received while the meter is running. It is recommended that you set the correct speed setting by selecting the type of connection you have in the "Speed" list. You can edit, add and delete connection profiles by clicking on the "Edit" button.

If you want (recommended ) you can check the "Load ... with windows" option. When this option is set, Traffic Meter will start automatically when Windows starts. The chart window will be displayed as soon as the program is started. You can enable "Don't show meter at startup" to prevent this.
Another feature is the "Prefer bytes over bits": If this is checked all values will be displayed in bytes. One byte equals 8 bits. If this option is not set, all measurements will be displayed in bits.
When the meter is moved to the borders of the screen it will try to dock. To turn this off, enable the "Disable chart window docking". This may be usefull on multimonitor setups.
Optionally you can choose to disable port analyses. If this option is enabled, the "port usage" page in the statistics window is disabled, but less cpu time is used by NET Traffic Meter. If the option "Don't save ports in statistics" is disabled, the results from the port usage analyses is also saved in the statistics file. This allows you to view "port usage" from other days as well, but it will use a little bit more cpu.