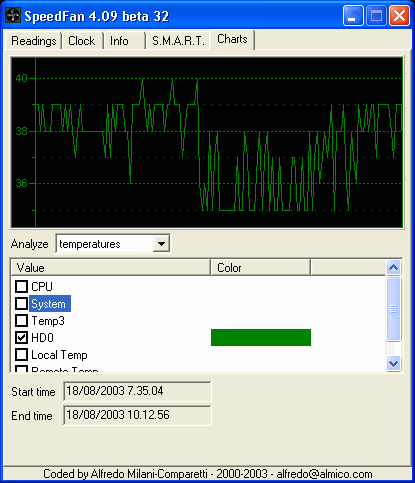
The CHART tab lets you graphically view the last values from your sensors.

Start
time and End time show the time interval available for
charting.
Whenever SpeedFan reads a new sample for any sensor, it
stores it its current value and timestamp. Some sensors are read less
often than others. For example: S.M.A.R.T.
sensors are read every 60 seconds, whereas other temperatures are
collected every 3 seconds. Whatever the sampling rate is, SpeedFan
will always show the full available interval. The samples stored for
each sensor will be limited. Currently this limit is set to 256
samples, but it might vary in the future. This means that SpeedFan
will show, at most, the last 256 samples.
You can select which kind of sensors' readings to compare (temperatures, fan speeds, voltages) and, within each type, you can choose which sensors to graph at the same time. Each sensor will be automatically given a different color.
The graph will be updated in real time.