About S.M.A.R.T. readings
S.M.A.R.T. technology is really interesting and
might be useful at addressing several HD related issues.
SpeedFan can help you by showing S.M.A.R.T. readings from available HDs.
Please note that HDs connected to SCSI and some IDE RAID controllers might not show up. Supporting these controllers is not an easy task. If any manufacturer would like to be supported, I will be pleased to receive any kind of info from them :-)
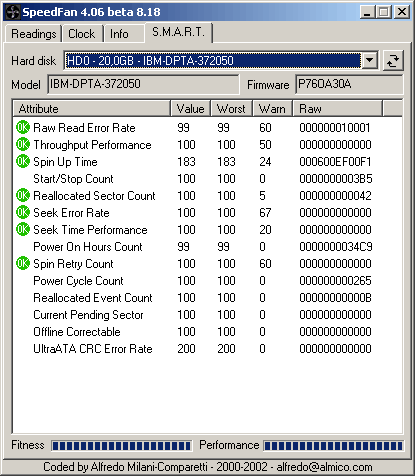
When looking at the S.M.A.R.T. tab, you will have to select an HD from the available list. You will get something like this:

For every S.M.A.R.T. attribute you will get the current VALUE, the WORST that has ever been registered, the THRESHOLD and the RAW reading.
You will see an icon too:
| this attribute is OK | ||
| this attribute is approaching its threshold | ||
| this attribute has already reached its threshold | ||
| <none> | this attribute has not been labeled by the manufacturer as relevant neither for performances, nor for fitness |
When any attribute reaches its threshold value,
you should carefully consider replacing your HD. Anyway: not every attribute is
considered as being "vital". Some of them are internally marked as
such, while others are not. Some other attributes are also marked as being
performance related and others aren't. According to these settings, SpeedFan
computes two indexes. One is FITNESS and the other one is PERFORMANCE. Both
these indexes will reach 0% when ANY of the attributes reaches its threshold
level. If this is not the case, both indexes will show a linear percentage of
how near to "warning condition" is the nearest attribute.
To make a long story short: those indexes will show a linear percentage where,
say, 50% means that the attribute that is nearer to its threshold is half way
between 100 and the threshold itself. Those indexes actually expand the dynamic.
An example:
| attribute | value | worst | threshold | (worst-threshold)/(100-threshold) | fitness |
| attr #1 | 95 | 80 | 40 | (80-40)/(100-40)=40/60=0.67 | 67% |
| attr #2 | 99 | 90 | 80 | (90-80)/(100-80)=10/20=0.50 | 50% |
The resulting FITNESS is the lowest one: 50%. As you can see, even if the worst value for attr #2 is higher than that for attr #1, its fitness is lower due to a different threshold.
The other common question is "what do all those attributes mean?"
Well... the main problem is that S.M.A.R.T. is a nice idea, but not that documented. I've searched through the internet and managed to find very little info about it. The only evident thing is that any attribute lower than its threshold is a bad thing. Nothing else is for sure.
Linearity in approaching the threshold level is unclear. I assume that, but it's my way of interpreting those info (I had to interpret it some way, didn't I? :-)). According to all the reports I've received, there are, for example, SEAGATE hard disks that report a very poor RAW READ ERROR RATE attribute, leading to a low WORST value and, according to the flags set for this attribute by the manufacturer, to a low FITNESS index. I can tell you little more. This happens even for brand new hard disks from this manufacturer. If you happen to discover more, feel free to let me know :-)