|
LoG is a very useful edge-detect and tracing filter. You shouldn't compare it to tracing programs like Corel Trace or Adobe Streamline for vector drawing programs, but if you want to use a similar feature in a bitmap application like Gimp, LoG is an excellent tool.
How To Use LoG
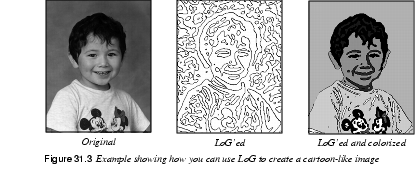
The LoG filter transforms scanned or computer-made images into black-and-white line art drawings, where each line is a closed curve. This makes it possible to create simple yet effective drawings by filling the closed curves with color, using the Bucket Fill tool.
You can also use it as a template or aid for hand-painted images. However, retouching to erase unwanted contours and close certain curves, in order to define the desired fill area, will be necessary in most cases.

Parameters
You'll need to set several parameters before applying this filter successfully.
Edge-Detect Lines
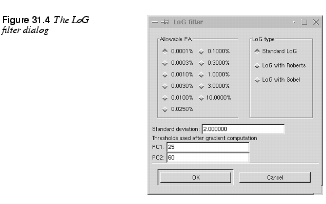
Allowable PA (percentage of allowable aliasing energy), or the tolerated amount of aliasing, is used to specify how edges are treated.
A high PA gives you a higher level of edge-detecting, which will result in a more precise line art output of your image. A high PA is recommended on complicated images where detail is important. Use a low PA on simpler images, or when you want a clean output .
.
LoG Rendering Types
There are three types of LoG rendering: Standard LoG, or LoG with Roberts and LoG with Sobel.
Standard LoG is perhaps a bit crude, but graphically clean and very powerful in its simplicity. Standard LoG creates a thick, closed border around objects; the higher the PA, the thinner the contour border.
Roberts and Sobel trace fine contours without borders and with more realism in the penwork. They make use of gradients to filter out spurious contours in the image. Their results are cleaner to look at, but important parts of the image are often lost.
Adjusting The Level Of Detail
To rectify this loss of image information, you should specify an appropriate Threshold range in the PC1 and PC2 fields. The PC1 threshold field sets the low threshold limit. Values below the specified value in this field will be ignored. The PC2 threshold field sets the high limit. Values exceeding the specified value in this field will be ignored.
Values within the specified threshold range are traced and displayed in the rendered image. If the image is generally low in contrast, you should increase the threshold range. For a bright image where contours are pale or unclear, set PC1 to 0 and PC2 to a relatively low value, like 50 or 60. Then, the filter will disregard brighter values and concentrate on tracing darker areas. If the image is dark, set the threshold values in the opposite direction.
If you want more detail in the traced image, you must lower the Standard deviation value. However, a Standard deviation lower than the default value (which is 2.0) requires a higher PA (3.0 or 10.0) to work properly. Raising the Standard deviation results in larger, softer curves with less detail.
|