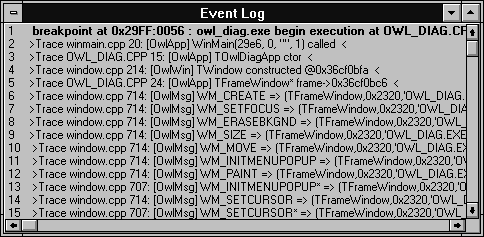
Figure B - The IDE's Event Log window can display diagnostic messages from your application.

December, 1994 - Vol. 1 No. 12
In Viewing debug messages with DIAGXPRT from last month's issue of Borland C++ Developer's Journal, we told you about an example application called DIAGXPRT.EXE. (Borland provides the source code for this applicationbut it doesn't ship the executable.) We also showed how you could use this application to view debug messages from another Windows application via calls to the TRACE or WARN macro or to the OutputDebugString( ) Windows API function.
However, to really exploit the power of the DIAGXPRT application, you can use it to display diagnostic messages that Borland already has placed in the OWL source code. (For more information on the diagnostic macros available in Borland C++ 4.0, see Borland C++ 4.0 Tip - Using the extended diagnostic macros in the April 1994 issue of Borland C++ Developer's Journal.)
In addition to displaying diagnostic messages with DIAGXPRT, you
can also use it to control the type of diagnostic messages the
OWL code generates. By viewing the diagnostic messages from the
actual OWL functions, you'll be able to follow the execution
of an OWL program more easily. In this article, we'll show
how you can use DIAGXPRT to both view and control the diagnostic
messages from the OWL source code.
You may not realize it, but Borland has embedded a great number of diagnostic messages in the OWL source code. The reason you wouldn't know this is that Borland hasn't enabled the diagnostic message macros in the versions of the OWL library that come with Borland C++ 4.0.
Since Borland built the shipping versions of the OWL library without
defining the __TRACE and __WARN constants, those
versions define the TRACE and WARN macros as null statements.
However, if you build a diagnostic version of the OWL library
(the diagnostic version defines those constants), you'll
be able to link your OWL application to a version of the OWL code
that displays these messages from the OWL source files. (See Debugging OWL 2.0 applications - Building a diagnostic version of the OWL 2.0 library for
more information.)
As we mentioned in the April article, you can create your own diagnostic groups in addition to the default Def diagnostic group that the CHECKS.H file defines. (By creating diagnostic groups, you can selectively display different types of diagnostic messages.)
The OWL design team took advantage of this capability and defined six diagnostic groups for displaying messages from the OWL source files. Table A lists the OWL diagnostic groups and describes the messages that each group displays.
Table A: Each OWL diagnostic group controls a different type of message from the source code.
| Diagnostic group | DIAGXPRT description | Type of diagnostic message |
| OwlApp | Application | Messages from the TApplication class |
| OwlWin | Window | Messages from the TWindow class and derived classes |
| OwlMsg | Window Tracing | Windows messages sent to this application's windows |
| OwlGDI | GDI | Messages from the TGdiObject class and derived classes |
| OwlGDIOrphan | GDI Orphan Warnings | Messages about GDI resource deallocation |
| OwlDocView | Document View | Messages from the Doc/View architecture classes |
To control the OWL diagnostic groups, you can use a dialog box in the DIAGXPRT application to update a settings file named OWL.INI. In this file, the DIAGXPRT application stores the current enable/disable flags and diagnostic levels for each of the OWL diagnostic groups.
When you launch an OWL application that uses the diagnostic version of the OWL library, the application reads these settings from the OWL.INI file, enables or disables the diagnostic groups, and then sets the diagnostic levels accordingly. By setting the enable/disable flags and the diagnostic levels appropriately, you can force the OWL code to display only the messages you're interested in following. Figure A shows the section of a typical OWL.INI file that holds the settings for the OWL diagnostic groups.
Figure A - The OWL.INI file contains the enable/disable flag and the diagnostic level for each OWL diagnostic group.
[Diagnostics]
OwlApp=1 1
OwlWin=1 1
OwlMsg=1 1
OwlGDI=1 1
OwlGDIOrphan=1 1
OwlDocView=1 1
Enabled=1
For example, if you enable all the OWL diagnostic groups and set the diagnostic level for each group to 1, the messages from the OwlMsg diagnostic group (Windows messages sent to the application's main window) will outnumber the other messages by a factor of 100 to 1 or more. If, instead, you disable the OwlMsg diagnostic group, you'll be able to follow the less frequent messages more easily.
In addition to displaying the messages from inside the OWL code, you can create messages that are part of the OWL diagnostic groups. Instead of creating a diagnostic group with the DIAG_DEFINE_GROUP macro we used in the April issue, you'll use the DIAG_DECLARE_GROUP macro.
This macro doesn't create a new diagnostic group; it simply allows you to use a diagnostic group that's been defined in another module. If you use an OWL diagnostic group name with the DIAG_DECLARE_GROUP macro, you'll be able to create messages that belong to that group.
To see how the OWL diagnostic groups can help you view the OWL
diagnostic messages, let's create a simple OWL application
that uses the diagnostic version of the OWL library. In addition,
we'll create messages in our program that will belong to
the OwlApp diagnostic group.
To begin, launch the Borland C++ 4.0 Integrated Development Environment (IDE). Choose New Project... from the Project menu. In the New Project dialog box, enter \OWL_DIAG\OWL_DIAG.CPP in the Project Path And Name entry field, select Application [.exe] from the Target Type list box, select Windows 3.x (16) from the Platform combo box, and then select the OWL check box in the Standard Libraries section.
To use the diagnostic version of the OWL DLL, select the Dynamic and Diagnostic check boxes in the Standard Libraries section. Click OK to create the new project.
When the project window for the OWL.IDE project appears, double-click on the name OWL_DIAG [.CPP]. When the editing window for this file appears, enter the code from Listing A. When you finish entering the code, choose Save from the File menu.
Listing A: OWL_DIAG.CPP
#include <owl\applicat.h>
#include <owl\checkbox.h>
#include <owl\dc.h>
#include <owl\framewin.h>
#include <owl\owlpch.h>
#include <owl\eventhan.h>
#include <owl\listbox.h>

DIAG_DECLARE_GROUP(OwlApp);

class TOwlDiagApp : public TApplication
{
  public:
  TOwlDiagApp( )
   { TRACEX(OwlApp, 0, "Level 0 Constructor");
   { TRACEX(OwlApp, 1, "Level 1 Constructor");}

  ~TOwlDiagApp( )
   { TRACEX(OwlApp, 0, "Level 0 Destructor");
   { TRACEX(OwlApp, 1, "Level 1 Destructor");};

  void InitMainWindow( )
   { TFrameWindow* frame =
       new TFrameWindow( 0, "OWL_DIAG.EXE");
     frame->AssignMenu(1);
     SetMainWindow( frame ); }

   void SampleCommand( );

  DECLARE_RESPONSE_TABLE(TOwlDiagApp);
};

DEFINE_RESPONSE_TABLE1(TOwlDiagApp,TApplication)
  EV_COMMAND(101,SampleCommand),
END_RESPONSE_TABLE;


void TOwlDiagApp::SampleCommand( )
{
  TRACEX(OwlApp, 2,
         "SampleCommand( )"<<"(added text)");
  GetMainWindow( )->MessageBox("Sample Command",
                              "Message", MB_OK);
}

int
OwlMain(int, char**)
{
  return TOwlDiagApp( ).Run( );
}
Next, choose New from the File menu and enter the resource code from Listing B in the editing window that appears. When you finish entering this code, choose Save from the File menu, enter OWL_DIAG.RC in the Save File As dialog box, and then click OK.
Listing B: OWL_DIAG.RC
1 MENU
{
 POPUP "Command"
 {
  MENUITEM "Sample", 101
 }
}
To allow the compiler to use the default module definition file, right-click on the name OWL_DIAG [.DEF] in the project window and choose Delete Node from the pop-up menu. Click Yes when the IDE asks if you want to delete this node.
To display the Event Log window, choose Event Log from the View menu. (Initially, we'll use this mechanism to view the OWL diagnostic messages.)
Build and run the application by choosing Run from the Debug menu. When the IDE finishes building the application, the main window for the OWL_DIAG.EXE application will appear. (You may see a Cannot write to device AUX System Error message appear the first time you run the application. If so, click Cancel in the message box.)
At this point, the application should have sent a number of diagnostic messages to the event log. Unfortunately, the IDE's Event Log window won't display these messages until you halt the application by quitting or using a breakpoint. To confirm this, press [Alt][Esc] to return to the IDE, and notice that the Event Log window is empty.
Press [Alt][Esc] twice to return to the OWL_DIAG application. Now, choose Sample from the Command menu (this generates another diagnostic message) and click OK in the Message dialog box that appears. Then, close the OWL_DIAG application by double-clicking on its System menu icon.
When the IDE's main window reappears, you'll see that the Event Log contains many messages. Use the vertical scroll bar on the Event Log window to view the beginning of the information.
At the beginning of the log, you'll see two diagnostic messages from the file OWL_DIAG.CPP intermixed with messages from some of the OWL source files, as shown in Figure B. Also, notice that the messages from this file are part of the OwlApp diagnostic group.

Figure B - The IDE's Event Log window can display diagnostic messages from your application.
However, you'll notice that the diagnostic messages from the OwlMsg diagnostic group (those that show [OwlMsg] after the source line number) easily outnumber the messages from the OwlApp and OwlWin diagnostic groups. To see how significant this problem can be, use the Event Log's vertical scroll bar to try to locate the diagnostic message from the SampleCommand( ) member function.
As you can tell from viewing the Event Log window, disabling the
OwlMsg diagnostic group would make it much easier to spot the
OWL messages you're interested in viewing. The DIAGXPRT
application was designed to provide this type of OWL diagnostic
message control.
Now, close the IDE by choosing Exit from the File menu. When the Windows Program Manager reappears, double-click on the DIAGXPRT icon in the Borland C++ 4.0 program group. (Last month's issue describes how you can build the DIAGXPRT.EXE file and add the application's icon to this group.)
When the DIAGXPRT main window appears, click the () icon (if necessary) to enable message logging. Then, click the Configuration icon () to display the Settings dialog box.
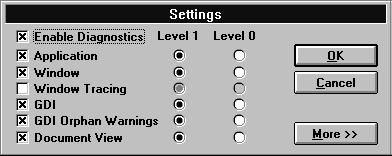
In this dialog box, you'll see a check box that enables or disables all OWL diagnostics, as well as individual check boxes that enable the OWL diagnostic groups. (You can identify which description applies to a specific diagnostic group by referring to Table A.)
To prevent the OWL_DIAG application (or any other application that's using the diagnostic version of the OWL library) from displaying messages from the OwlMsg diagnostic group, deselect the Window Tracing check box, as shown in Figure C. Click OK to save this change in the OWL.INI file.

Figure C - You use the Settings dialog box to configure the OWL diagnostic groups.
To run the OWL_DIAG application from Windows Program Manager, press [Alt][Esc] to make the Program Manager active, then choose Run... from the File menu. Enter \OWL_DIAG\OWL_DIAG.EXE in the Run dialog box and click OK. (Since DIAGXPRT and the IDE's Integrated Debugger can interfere with each other when they run at the same time, you'll want to run diagnostic applications directly from Windows if you use the DIAGXPRT application to view the diagnostic messages.)
When the OWL_DIAG application begins, choose Sample from the Command menu and then click OK in the message box that appears. If the DIAGXPRT window is visible in the background, you'll see some diagnostic messages appear in that window.
Now, double-click on the OWL_DIAG application's System menu icon to close the application and then bring the DIAGXPRT window to the front. Already, you can see that viewing diagnostic messages with DIAGXPRT has advantages over using the Event Log in the IDE.
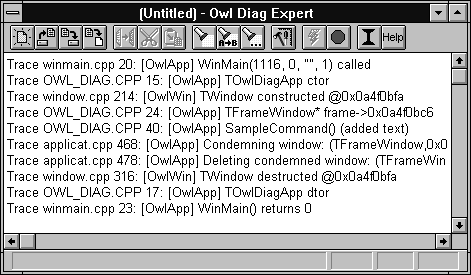
First of all, even when the OWL_DIAG application was running, you could view the diagnostic messages in the DIAGXPRT window. Second, by disabling the OwlMsg diagnostic group with DIAGXPRT, you've made it much easier to locate the diagnostic messages you created, as shown in Figure D. To close the DIAGXPRT window,

Figure D - The DIAGXPRT application displays diagnostic messages as they occur.
double-click on its System menu icon.
The extended diagnostic macros TRACEX and WARNX
let you control diagnostic messages by creating custom diagnostic
groups. By using the DIAGXPRT application and a diagnostic version
of the OWL library, you can view the diagnostic messages that
Borland has embedded in the OWL source code to trace the execution
of an OWL application.
Copyright (c) 1996 The Cobb Group, a division of Ziff-Davis Publishing Company. All rights reserved. Reproduction in whole or in part in any form or medium without express written permission of Ziff-Davis Publishing Company is prohibited. The Cobb Group and The Cobb Group logo are trademarks of Ziff-Davis Publishing Company.