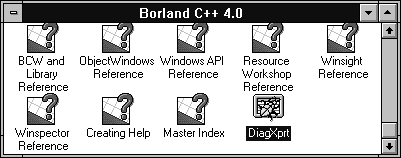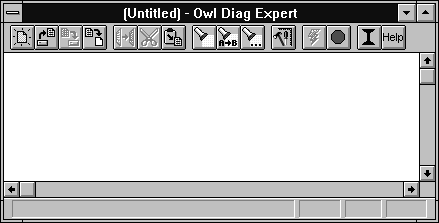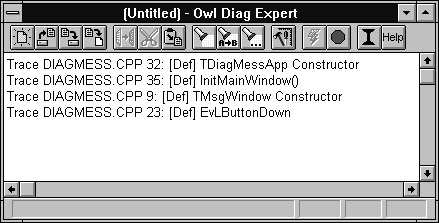
Figure A - If you put a Program Item for DIAGXPRT in your Borland C++ Program Group, you'll be able to access it easily.

November, 1994 - Vol. 1 No. 11
If you write complex Windows applications, you probably want to trace their path of execution from time to time. If you want to check if and when your program reaches some specific, regular locations, you can use the Integrated Debugger in the Borland C++ 4.0 Integrated Development Environment (IDE) or the Turbo Debugger for Windows (TDW) to set a breakpoint for each location.
However, if you're more interested in recording the path of execution than examining the current values of variables or registers, you may instead want to log a series of diagnostic text messages, or debug messages, that identify important landmarks within your program. In a DOS program, you could simply use printf() or cout statements to write the debug messages to the standard output device. A better alternative for DOS programs is to use the diagnostic macros to log this information. (For more information, see 4.0 Debugging Technique - Adding the new diagnostic macros to your codein the March 1994 issue of Borland C++ Developer's Journal.)
In a Windows program, you can use the OutputDebugString()
API function or the extended diagnostic macros to display debug
messages. Unfortunately, viewing the debug messages from a Windows
program can be somewhat cumbersome. In this article, we'll
show how you can use DIAGXPRT, a special example program included
with Borland C++ 4.0, to easily view the debug messages from a
Windows program.
In general, there are five ways to view debug messages from a
Windows program:
You're probably familiar with the first four methods. However,
if you want to view the debug messages as they occur (since TDW
and the integrated debugger don't display these messages
until you hit a breakpoint or exit), you may want to try DIAGXPRT.
DIAGXPRT is an ObjectWindows Library (OWL) example program. Basically, you can use DIAGXPRT to view and record debug messages from the OutputDebugString() API function or diagnostic macros in a Windows application.
You'll find the DIAGXPRT project in the
\BC4\EXAMPLES\OWL\OWLAPPS\DIAGXPRT
directory. Borland doesn't mention this program in the
documentation that accompanies Borland C++ 4.0, but at the very
least, you'll want to take a look at the program's
capabilities. (You may also want to take a peek at the source
code.)
In the past, most programmers writing Windows applications used the API function OutputDebugString() to log debug messages. However, the diagnostic macros TRACE and WARN, as well as the extended diagnostic macros TRACEX and WARNX, build on this functionality.
In fact, the diagnostic macros use the same basic mechanism for displaying output data that the OutputDebugString() API function uses. Therefore, no matter how you choose to display the debug messages (secondary monitor, COM port, debugger, or DIAGXPRT), you'll be able to view them the same way.
If you use the OutputDebugString() function, you'll
have to explicitly surround each occurrence of the function call
with some type of conditional #DEFINE statement (to disable
the debug message code when you finish debugging). If you use
the diagnostic macros instead, you can enable all the TRACE
and TRACEX statements by adding a #DEFINE statement
for the __TRACE constant. Independently, you can enable
all the WARN and WARNX statements by adding
a #DEFINE statement for the __WARN constant.
If you're writing an OWL-based Windows application, you have some additional options available. You can still use the API function OutputDebugString() and the diagnostic macros, but you can also use an external setting from the OWL.INI file to determine how the diagnostic macros display their messages.
You could use a text editor to manually change the debug message
setting in the OWL.INI file, but Borland has provided this functionality
in the DIAGXPRT application itself. Before you can use the DIAGXPRT
application, you'll have to build it (since it's
one of the example programs).
To begin, launch the Borland C++ 4.0 IDE. When the IDE's
main window appears, choose Open Project... from the
Project menu, enter
\BC4\EXAMPLES\OWL\OWLAPPS\DIAGXPRT\DIAGXPRT.IDE
in the File Name entry field of the Open Project dialog box, and click OK.
When the DIAGXPRT.IDE project window appears, choose Make All
from the Project menu. When the IDE finishes building this project,
switch to Program Manager and create for DIAGXPRT.EXE a new Program
Item in the Program Group that contains Borland C++ 4.0. When
you do, you'll see a custom icon for the DIAGXPRT application,
as shown in Figure A.

Figure A - If you put a Program Item for DIAGXPRT in your Borland C++ Program Group, you'll be able to access it easily.
When you finish creating the new Program Item, switch back to
the IDE. When the IDE's main window reappears, choose Close
Project from the Project menu.
To demonstrate how you can display the output from the diagnostic macros in the DIAGXPRT window, let's add those macros to a very simple Windows application. To create the project, choose New Project... from the Project menu.
In the New Project dialog box, enter \DIAGMESS\DIAGMESS.IDE in the Project Path And Name entry field, select Application [.exe] from the Target Type list box, select Windows 3.x (16) from the Platform combo box, and then select the OWL check box in the Standard Libraries section. Click OK to create the new project.
When the DIAGMESS.IDE project window appears, double-click on the name DIAGMESS [.CPP]. When the editing window for this file appears, enter the code from Listing A.
Listing A: DIAGMESS.cpp
#define __TRACE
#include <owl\applicat.h>
#include <owl\framewin.h>

class TMsgWindow : public TWindow
{
  public:
    TMsgWindow(TWindow* parent = 0)
    { TRACE("TMsgWindow Constructor");
      Init(parent, 0, 0); }

  protected:
    void EvLButtonDown(UINT, TPoint&);

    DECLARE_RESPONSE_TABLE(TMsgWindow);
};

DEFINE_RESPONSE_TABLE1(TMsgWindow, TWindow)
  EV_WM_LBUTTONDOWN,
END_RESPONSE_TABLE;

void TMsgWindow::EvLButtonDown(UINT,
                              TPoint&)
{ TRACE("EvLButtonDown");
  MessageBox("WM_LBUTTONDOWN Message",
    "Responding to Message", MB_OK);
}

class TDiagMessApp : public TApplication
{
  public:
    TDiagMessApp()
    { TRACE("TDiagMessApp Constructor"); }

    void InitMainWindow()
    { TRACE("InitMainWindow()");
      SetMainWindow(new TFrameWindow(0,
        "Message Response Program",
        new TMsgWindow));
    }
};

int OwlMain(int, char* [])
{
  return TDiagMessApp().Run();
}
When you finish entering the code, choose Save from the File menu. Next, right-click on the name DIAGMESS [.RC] and choose Delete Node from the pop-up menu. Click Yes when the IDE asks if you want to delete this node, and then repeat these steps to delete the DIAGMESS [.DEF] node.
Now, build the application by choosing Make All from the Project menu. When the IDE finishes compiling and linking the application, choose Exit from the File menu to shut down the IDE.
When the Program Manager window reappears, double-click on the DIAGXPRT Program Item in the Borland C++ Program Group. When the DIAGXPRT main window appears, it will display an empty log window, as shown in Figure B. To enable the message logging function, click the toolbar button that has a lightning bolt icon.

Figure B - Initially, the DIAGXPRT log window is empty.
Now, switch back to Program Manager. To launch the DIAGMESS.EXE application, choose Run... from the File menu, enter \DIAGMESS\DIAGMESS.EXE, and click OK.
When the DIAGMESS.EXE main window appears, left-click in the center of the window. As soon as the Responding to Message message box appears, click OK and then switch to the DIAGXPRT application. In the DIAGXPRT log window, you'll see the diagnostic messages from the DIAGMESS application, as shown in Figure C.

Figure C - The DIAGXPRT main window will display all the debug messages from the diagnostic macros.
Switch back to the DIAGMESS application and double-click on its
System menu icon to exit. When the DIAGXPRT window reappears,
double-click on its System menu icon to return to Program Manager.
When you're using DIAGXPRT, you can manipulate the debug message log text with operations you'd expect from a simple text editor. For example, you can embed your own text notes in the middle of the log, you can find and replace text strings, and you can load and save log files.
In addition, if you choose Decorated from the System menu, DIAGXPRT will hide the tool bar and reduce the size of the title bar to increase the viewable area of the window. If you choose the Decorated command again, DIAGXPRT will redisplay the standard tool bar and title bar.
Finally, don't run the IDE and DIAGXPRT at the same time or you'll see some strange conflicts. These conflicts occur when the IDE and DIAGXPRT both try to intercept calls from TOOLHELP.DLL in Windows.
Next month, we'll show how you can perform more extensive
execution tracking by using TRACEX and WARNX
messages you create, as well as the ones Borland included in the
OWL source code. This will help you debug your applications and
gain a better understanding of how OWL behaves at runtime.
Tracing the execution of a Windows program is a common but cumbersome
task. By using the DIAGXPRT application and placing the diagnostic
macros in your code, you can simplify this debugging method.
Copyright (c) 1996 The Cobb Group, a division of Ziff-Davis Publishing Company. All rights reserved. Reproduction in whole or in part in any form or medium without express written permission of Ziff-Davis Publishing Company is prohibited. The Cobb Group and The Cobb Group logo are trademarks of Ziff-Davis Publishing Company.