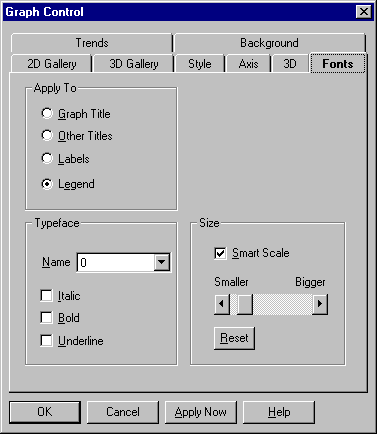
This tab give you a number of options for setting font properties.

Font property settings are described in the following table.
|
Setting |
Description |
|
Graph Title
|
Select this option to apply font settings to the graph's title, which always appears centered at the top of the graphing window. |
|
Other Titles |
Select this option to apply font settings to the graph's left, right, and bottom titles. The same settings apply to all three of these titles. |
|
Labels |
Select this option to apply font settings to the graph's labels, including axis labels (for graphs with X-Y-Z grids and polar graphs), pie chart labels, and data labels. The same settings apply to all labels in the graph. |
|
Legend |
Select this option to apply font settings to the graph's legend. |
|
Name
|
In this list box, select any installed Windows font for the selected text. |
|
Italic
|
Select this option to italicize the text. |
|
Bold
|
Select this option to display the text in boldface. |
|
Underline
|
Select this option to underline the text. |
|
Smart Scale
|
Select this option to have the Graph Control automatically use smaller type if the size you specify (using the Smaller-Bigger scroll bar) makes the text too large for the available space. If the Graph Control can't make the type small enough to fit, the text won't be displayed. If you deselect Smart Scale, the Graph Control won't attempt to use type smaller than you specify with the Smaller-Bigger scroll bar. If the text is too large for the space available, it won't be displayed. |
|
Smaller-Bigger |
This scroll bar lets you set the size of type. If Smart Scale is selected, the Graph Control may override your setting to make the text small enough to fit in the graphing window. Each click the Smaller end of the scroll bar decreases the text size by 5 arbitrary units (to a minimum of 50), and each click the Bigger end increases it by 5 units (to a maximum of 500). The initial size depends on which type of text you're sizing. |
|
Reset |
Choose this button to reset the text size to the default. |