Examples of ChromaCurve Graph Adjustments
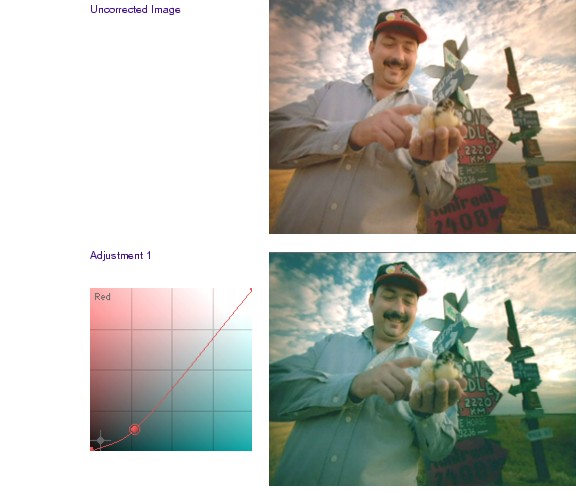
The following illustrations show a series of simple adjustments made to an image using the Red ChromaCurve graph in the Curves tab. By comparing the results of these adjustments, you will learn how curves can be used to control color across different parts of the brightness range.
In each adjustment example, the new corrected image and the curve used to produce it are shown together with one other image from the series for the purpose of comparison.
 | |
In each example, the color of the background behind the control point
represents the color change to the image. In the first example, creating a
curve through the darker cyan area causes reds to be reduced in the darker
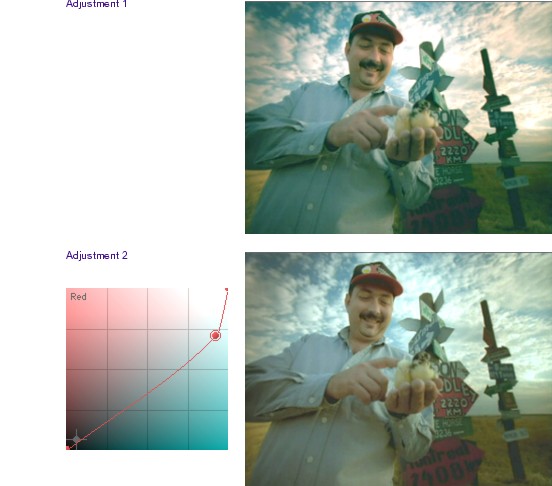
parts of the image. In the second example, creating a curve through the
lighter cyan area causes reds to be reduced in the lighter areas of the
image.
|
Adjustment 1. Red is reduced primarily in the shadows range (the lower part of the curve). Notice how much of the red tone is lost from the background grass, the shirt, and the lower red signpost, which loses much of its detail. The higher red signpost is relatively less desaturated, however, and some of the reddish tinge is retained in the cloud highlights in the top right.
Adjustment 2. Red is reduced primarily in the highlights range (the upper part of the curve). The differences between this adjustment and adjustment 1 are most apparent in the lower signpost, which retains more redness and detail, and in the background, where the crop in the lower right retains more red tones, but the cloud highlights in the top right have lost their red tinge.
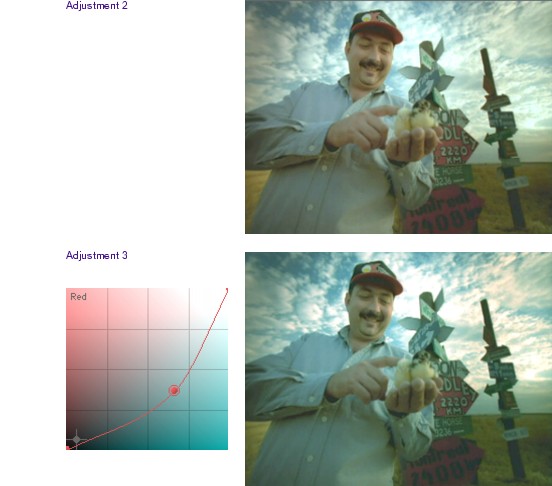
Adjustment 3. Red is reduced more evenly across the entire luminance range but with the largest change in the midtones. Though the differences between this adjustment and adjustment 2 are subtle, the strong midtone reduction in red is most noticeable in the skin tones, which appear more gray than in either adjustment 1 or adjustment 2. However, adjustment 3 retains both some detail in the lower signpost and some of the reddish highlights in the clouds.
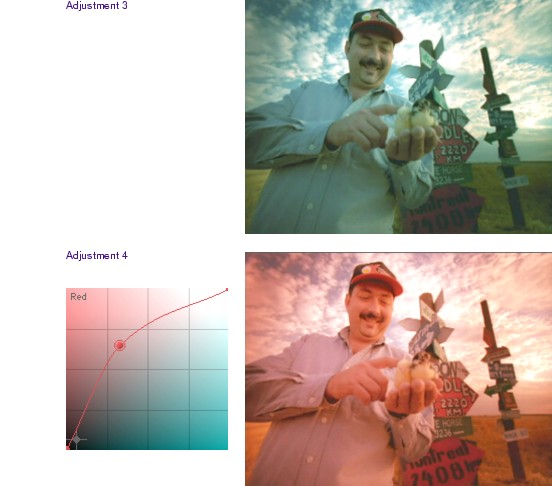
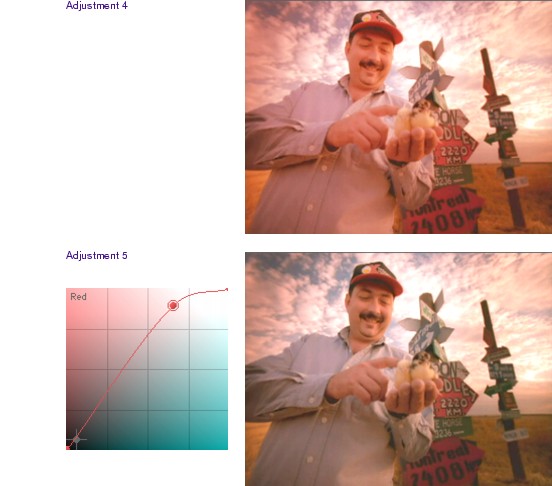
Adjustment 4. Red is boosted relatively evenly across the entire luminance range but with the largest change in the midtones. Here the difference from adjustment 3 is obvious throughout the image. The most extreme differences appear in the midtone range, for example, in the hands.
Adjustment 5. Red is boosted primarily in the highlights range. Here the most noticeable difference can be seen in the crop in the background. In adjustment 4, where red has been boosted more in the lower ranges, the crop looks more orange. In adjustment 5, where red has been boosted very little in the shadows range, the crop looks more yellow-green.
Adjustment 6. In the final adjustment, red is boosted primarily in the shadows range. In comparison with adjustment 5, there is much more of a red or orange tinge in the darker parts of the image (for example the crop in the lower right and the lower part of the shirt). Highlights in the clouds, however, have much less of a red tinge.