Understanding ChromaCurve Graphs
A ChromaCurve graph shows the relationship of input values (on the horizontal axis) to output values (on the vertical axis). A background grid indicates the quartile points on each axis to assist you when you are reading the graph and making adjustments.
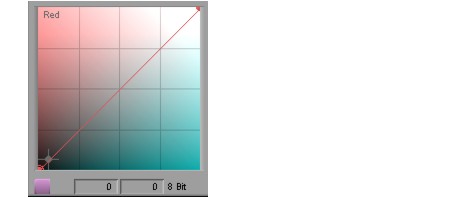
The following illustration shows the Red ChromaCurve graph.
The default curve (before you make any adjustments) is an ascending 45° straight line, since input and output values are the same across the entire range. The control points for the two ends of the curve are set by the system, but you can change their location.
If you make an adjustment that moves part of the line below the 45° angle, you make the output values for that part of the image lower than the input values. If you make an adjustment that moves part of the line above the 45° angle, you make the output values for that part of the image higher than the input values.
If you make an extreme adjustment to a curve so that it becomes a horizontal line, you are converting all input values to the same output value (128). When this adjustment is made across all three color channels, the result is a uniform, midgray image.
When you make less extreme adjustments, the result is a true curve, since the graph updates by calculating a curve based on the values of the control points and their positions with respect to one another.
In each of the Red, Green, and Blue ChromaCurve graphs, the color of the background indicates what color in the image is adjusted if you created a curve through that part of the graph. The upper left corner of the graph is the color of the graph name (red, green, blue) and represents complete saturation in that color. The lower right corner of the graph is the complementary color (cyan, purple, yellow). The upper right corner is white and the lower left corner is black.
The Master ChromaCurve graph controls overall luminance in the image. The grayscale tone of its background indicates the luminance range that is affected by that part of the graph but does not directly indicate the result of an adjustment. Adjustments that result in parts of the graph being above the default 45° angle make those areas of the image brighter. Adjustments that result in parts of the graph being below the default 45° angle make those areas of the image darker.
For examples showing how various curves affect an image, see
Examples of ChromaCurve Graph Adjustments.