The statistics window contains 5 tabs. They provide general information about the amount of download and upload, the rate (speed) and the amount of time connected. The first today tab also indicates an estimated value of upload, download an total transfer on the end of the month.

The "Daily", "Weekly" and "Monthly" reports the total amount of data transferred for each date.
By default, only statistics conserning the current year and month are displayed. If you enable the "Show all statistics" option, all data is displayed, regardless of the current date.
Some ISP use this method to elliminate traffic burst peaks on webservers etc... to prevent immediate or high costs to their clients. NET Traffic Meter can calculate the 95th percentile to an accuracy of 720 samples a month. If this option is enabled you will see a different volume chart calculated by this method.
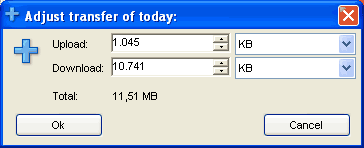
In the "today" page you have a button called "Adjust amount...". This can be used to add or subtract download or upload amounts in order to synchronise your volume with your Internet Service Provider. Sometimes your ISP can experience technical difficulties counting the amount of data you download and then it might be usefull to adjust you statistics.
Optionally, if a plugin is already available for your internet service provider, you can install a synchronise plugin that will adjust your volume to the volume your ISP measures.


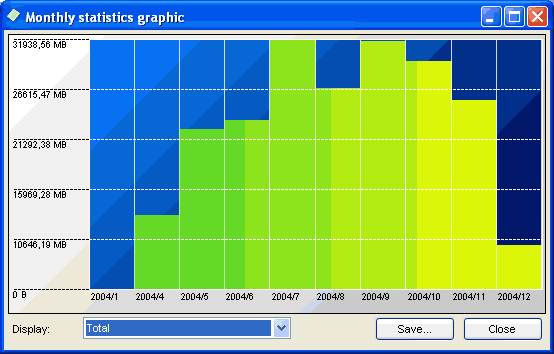
Under the daily, weekly and monthly table you have a button called "Show chart". When you click on this button you will see a new window displaying a graphical representation of the upload, download and total. If you select the "Show all statistics" option all data is displayed instead of the relevant data to this volume pack or period.
You can click on the "Save" button to save the graphic as a bmp, jpg or png image.
The volume tab displays a graphical representation of your the amount of volume you have spent. In addition, if you have a "monthly-based volume" on your connection you can see light-green bars that represent the volume you could used for each day. ( If your current volume exceeds this bar, it will be drawn in red from the point where you exceed it. )
Clicking on the "Save..." button will allow you to save the volume graphic as a bmp, png or jpg image.
You can use the "Export" button to save the statistic data from the charts into a Rich Text Document (RTF), which can be read by almost any application. If you want to process the statistics from NET Traffic Meter you may want to export the data as a CSV (Comma Seperated Value) file. This can be read by many, for example Excel, applications to draw charts and analyse your statistics.
The "Open" and "Save" buttons can be used to backup and import the statistic data of NET Traffic Meter.
The "Clear" button will remove all data available and thus wiping all statistics...
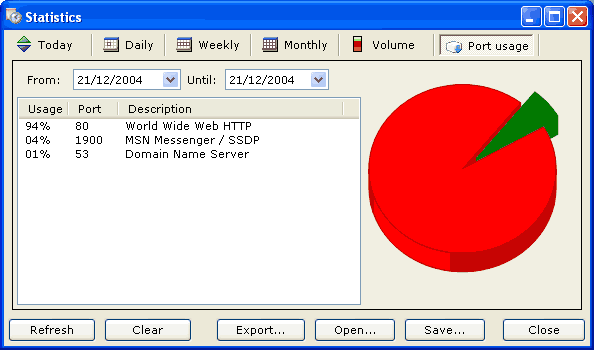
Net traffic meter can also annalyse the kind of network traffic you have. If you take a look at the port tab you will see a list that summerizes all the different ports the network packets use.

It is mentioned with a usage value in percent and a possible description of the kind of traffic. On the right side, you will see a chart representing the moest frequent kind of traffic. Move over a slice to see it's description.