Solar Activity Cycles
Almost all important phenomena on the Sun show periodic behaviour.
From the historical point of view the best-known is the periodical occurrence
of sunspots.
The eleven-year cycle
The most obvious manifestation of the solar periodic activity is the eleven-year
cycle. Evidence of it can be seen in a number of different characteristics of
the solar activity, the most striking of which is the number of sunspots. This
eleven-year solar cycle was discovered by Heinrich Samuel Schwabe (1789 - 1875).
He succeeded in presenting reliable proof of this cycle by studying historical
documents going back in history to about 1716. The following picture shows the
average values of the relative number of sunspots (N) since 1749. An
uninterrupted series of sunspots observations exists from this year onwards
until today. The relative number of sunspots was introduced by Rudolf Wolf
(1816 - 1893), head of the astronomical observatory in Zⁿrich. The number is
determined from the number of sunspot groups G and the total number of
sunspots S visible at a given moment on the Sun using the formula
N = 10G + S.
The blue numbers above the maxima indicate the maximum average value
of the relative number of sunspots per month within the given cycle. The cycles
are numbered in a standard way and the cycle numbers are displayed in red. In 1999 there was
the 23rd cycle.
Maunder's minimum
The attempts to extend the series of observations of the eleven-year cycle way
back before 1716 were initially unsuccessful. Although there were historical
resources available their study resulted in very low values of the relative
number. At first, the resources were considered unreliable. The first person to
come up with the idea that in the second half of the 17th century the
eleven-year cycle almost did not exist was the English physicist Edward
Walter Maunder (1851 - 1928). Recent research provides a number of indirect,
but very plausible, proofs that he was right. The existence of what is called
Maunder's minimum is supported, for example, by the study of tree rings,
historical documents confirming that, within the given period, neither a
single sunspot nor the
aurora were observed,
and that there were striking climatic changes. The period of Maunder's minimum
is matched closely by the exceptionally cold weather in Europe, sometimes
referred to as the Little Glacial Epoch. The following diagram shows
the estimated relative numbers of the sunspots derived from historical
resources going back to about 1650. Only individual observations are
plotted before 1650. They do not create a continuous series.
The butterfly diagram
Sunspots do not occur throughout the whole of the solar photosphere. Most
frequently, they can be found in the area between 35░ northern and
35░ southern heliographic latitude. Only rarely will a sunspot occur
farther than 40░ from the Sun's equator. No sunspots occur in the
area around the solar poles. In the first half of the 19th century
the amateur astronomer Richard Christopher Carrington (1826 - 1875)
discovered, by carefully plotting the positions of the sunspots,
that the heliographic latitude where the sunspots occur most
frequently changes remarkably within the eleven-year cycle. After a period
of minimum solar activity sunspots begin to appear about 30░ away from the
equator, both on the southern and northern hemisphere. As they grow in number
over time, the area of the most frequent occurrences shifts to the lower
heliographic latitudes. During maximum activity the sunspots occur most
frequently about 15░ away from the equator. Then their number decreases and the
occurrences move towards the equator. The cycle ends when the area with
sunspots reaches the equator. At that time, sunspots belonging to a new
cycle may already be present in higher heliographic latitudes. If we plot
the heliographic latitude of each spot in relation to time we will obtain
a diagram that is aptly called "the butterfly diagram".
L denotes the heliographic latitude. The intensity of grey
is proportional to the area covered by the sunspots. Consequently, the lighter
areas signify a greater occurrence of sunspots.
The twenty-two year magnetic cycle

In 1913, another interesting phenomenon concerning the occurrence of
sunspots was revealed. The discovery was mostly contributed by the American
astronomer George Ellery Hale (1868-1938). The sunspots, or sunspot groups,
usually occur in pairs oriented in the west û east direction. The western
sunspot is called leading, the eastern one is called following. The leading
spot has always the opposite polarity of the magnetic field to the following
sunspot. All leading spots in the northern hemisphere have the same polarity.
The same applies to the leading sunspots in the southern hemisphere. However,
the polarity of the leading spots in different hemispheres is different
(of course, the same is valid for the following sunspots). If we investigate
the behaviour of the polarity of the magnetic field of the sunspots in two
solar cycles following on from each other we find that a reversal of poles has
occurred, i.e. within the same hemisphere, the leading and the following spots
have exchanged their polarity. Consequently, in terms of the development of
sunspots, it would seem reasonable to speak of a twenty-two year cycle, rather
than an eleven-year cycle.
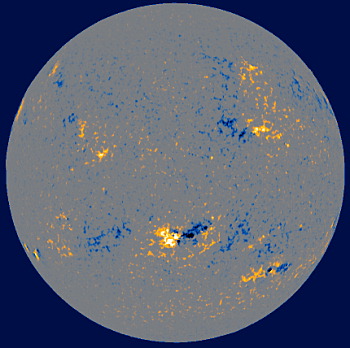
The magnetogram pictured on the left was made just a few hours after the solar
eclipse of August 11, 1999. The areas with different magnetic field polarity are
distinguished by different colors û orange and blue. The picture demonstrates
rather well the differences between the northern (upper) and southern (lower)
hemisphere.
Graphs were created according to data from
Sunspot Index Data Center, Brussels, magnetogram is based on data
from National Solar Observatory Kitt Peak, Arizona.
