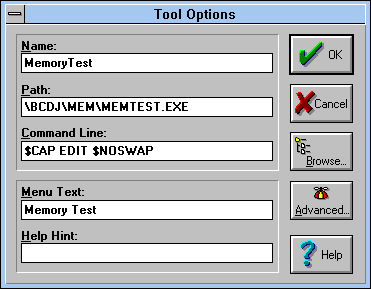
Figure A - You'll use the Tool Options dialog box to create the Memory Test IDE tool.

Without question, some of the most common C++ programming errors involve dynamically allocating memory. While there are several techniques you can use to combat these errors (using "smart" pointers, class-specific diagnostic code, and so on), errors can still creep into your projects.
For this reason, many developers depend on one of the many third-party diagnostic tools that track heap allocation. Bounds Checker, Smart Heap, and Heap Agent are powerful products that can locate these and many other types of errors.
However, if you don't currently own one of these products, you may want to consider creating your own set of diagnostic tools instead. By doing so, you'll benefit in two ways: You'll locate specific problems in your code, and you'll learn more about how dynamic memory allocation works.
In this article, we'll show how you can create debugging
versions of the new() and delete) operators
that store historical information about the way your project handles
dynamic memory allocation. In addition, we'll provide a
simple program you can use to produce a report from the log file
these operators generate.
Three significant errors account for most dynamic memory allocation problems. The first, and most common, mistake involves allocating memory but never releasing it.
For example, if your program allocates a buffer using the statement
char * buffy = new char[80];
the program must later release the memory by calling the statement
delete[] buffy;
If your program doesn't make this call, you've created what's known as a memory leak. The memory you allocated is lost, and your program won't be able to use it again.
You'll notice that we applied the array form of the delete() operator in this statement by placing [] before the array name. Even though Borland C++ will release this memory correctly if you use the standard form of the delete() operator, you should use the array form to conform to the language specification. Failure to use the array form is the second type of dynamic allocation error that you'll commonly find.
The third type of memory error you'll typically encounter in a C++ program involves the opposite extreme: releasing a given pointer more than once. This error seems most likely to occur after a programmer discovers several memory leaks and decides to release a block of memory at a specific point "just to be safe."
In rare situations, such a tactic can be useful. For this approach
to work, though, you'll need to write
delete buffy[];
buffy = NULL;
at every location where you may release the memory for the first time. If you don't set a released pointer equal to NULL (0), your program will probably crash if you use the delete() operator on that pointer a second time.
(According to the C++ language specification, calling delete()
on a NULL pointer is guaranteed to be harmless. In comparison,
the language specification doesn't define what happens
when you call delete() with a pointer you've already
released. In other words, the application will probably crash.)
To identify each of these three errors, you'll need to
In addition, you'll want to make it easy to enable and
disable this type of error test, if possible without modifying
your project's source files. The best way to achieve these
goals is to create your own versions of the new() and
delete() operators.
In C++, you have two options for altering the behavior of the new() operator. You can create a class-specific version of the operator (for example, to allocate certain types of small objects within a given region of memory), or you can provide your own version of the global new() operator (which the compiler will call for every type that doesn't define a class-specific version).
In general, your responsibilities when writing your own version of new() are simple: locate an appropriate amount of memory (the compiler passes the necessary size of the block as the only parameter to the new() operator) and return a pointer to that block of memory, or signal an appropriate error if an acceptable block isn't available (by throwing a memory allocation exception or by providing your own error-handler).
That's it. Anything else you do inside the new() operator is at your discretion.
For debugging purposes, you can simply hide extra information near the pointer that you return. To do so safely, you'll need to allocate enough memory to satisfy the program's request plus the number of bytes needed to store information about the pointer itself.
For example, if you want to keep track of the allocation type, you can call the runtime library (RTL) function malloc() to allocate a block of memory that's one byte larger than the size specified by the compiler in the size parameter. When the malloc() function returns a pointer to this block of memory, you can simply add the appropriate type information in the first byte of the block, and then use the address of the second byte as the return value for your new() operator.
In reality, you'll probably want to keep track of additional information, such as the size of the memory block you're allocating and some type of unique pointer identifier (the address itself isn't guaranteed to be unique). Plus, you'll probably want to provide some extra bytes before and after the memory block to keep your program from accidentally writing to these areas (another common programming error).
We suggest that you allocate enough memory to store the following
debugging information:
As you can see, adding this information will increase the size of each dynamic allocation by 11 bytes.
Once you've allocated enough memory to store this information with each pointer, you'll need to initialize each of these locations to the appropriate values. Then, for the byte that stores the allocation type, you can use a simple enumerated type to specify the pointer's type and its current state as one of four possible values: new standard, new array, deleted standard, and deleted array.
(Strictly speaking, if your program tries to release an allocated block twice and uses the wrong version of the delete() operator, it's a sign that your program has some significant problems. You'll want to know about both of these errors eventually, so you should report them as soon as possible.)
Next, you'll want to set the pointer identifier bytes to a value that's unique during the execution of the program. One way to generate this value is to define a static long-integer variable in the source file that defines the new() and delete() operators, initialize the variable to 1, and then increment it as you perform each successful allocation.
Finally, set the guard bytes to something appropriate. For the initial byte that appears prior to the buffer, you can use almost any specific value, but for the end guard byte, we suggest you use something other than 0. (If you're allocating memory for null-terminated strings, a 0 after the end of the block can help protect your program against some types of errors, but it may also hide errors that you need to fix.)
Once you've overloaded the standard form of the new()
operator, create the same basic definition for the array form.
However, make sure that you set the allocation-type byte to the
appropriate value in the array form.
In general, when you provide your own version of delete(),
you'll simply reverse the tasks you performed in the new()
operator. For our version, we'll do the following:
(As with the new() operator, you'll need to provide
a corresponding version of the array form of the delete()
operator.) In each case that the delete() operator can
detect that something's wrong with a pointer, we'll
try to take the safest course of action in correcting it by avoiding
multiple deallocations, using the correct form of the delete()
operator, and so on.
Now let's create a source file that replaces the global new() and delete() operators and an application that will process the debugging information they produce. To begin, launch the Borland C++ Integrated Development Environment (IDE), choose New from the File menu, and enter the code from Listing A.
When you've finished entering the code, choose Save from the File menu. In the Save As dialog box, enter the filename \BCDJ\DEBUGNEW.CPP in the File Name entry field and click OK. (If you don't have a directory named \BCDJ, you'll need to create it first.)
Next, choose the New Project... command from the Project menu, and then enter \BCDJ\MEM\MEMTEST.IDE in the Project Path And Name entry field. Select Application [.exe] in the Target Type list box, select DOS (Standard) from the Platform combo box, and then click OK. When the project window appears, double-click the name memtest [.cpp] in the project window, and enter the code from Listing B in the code editing window that appears.
When you've finished entering this code, choose Build All
from the Project menu. When the IDE finishes compiling and linking
the application, choose Close Project from the Project menu.
Now you can add DEBUGNEW.CPP to any project that uses the new() and delete() operators for memory allocation and deallocation, and you'll be able to accurately track errors. In addition, you can include the MEMTEST.EXE application on your project's Tools menu to integrate that application with the IDE.
For example, choose Open Project... from the Project
menu, enter
\bc45\examples\windows\whello\whello.ide
in the File Name entry field, and click OK. When the project window appears, right-click the name whello [.exe], and choose Add Node from the pop-up menu.
In the Add To Project List dialog box, locate and select the DEBUGNEW.CPP file you created earlier and click OK. You'll see the name debug [.cpp] appear in the project window.
Next, choose the Tools... command from the Options menu, and click New... in the Tools dialog box to create a new IDE tool. In the Tool Options dialog box, enter MemoryTest in the Name entry field, enter \BCDJ\MEM\MEMTEST.EXE in the Path entry field, enter $CAP EDIT $NOSWAP in the Command Line entry field, and enter Memory Test in the Menu Text entry field, as shown in Figure A. Click OK to create the tool, and then click Close in the Tools dialog box.

Figure A - You'll use the Tool Options dialog box to create the Memory Test IDE tool.
Now, choose Run from the Debug menu to compile and run the application. When the Hello, World window appears, double-click the System menu icon to close the application and return to the IDE.
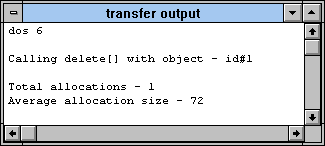
Finally, choose Memory Test from the Tools menu. When the application
finishes processing the data in the MEMTEST.LOG file, you'll
see the output from the MEMTEST.EXE application appear in the
Transfer Output window, as shown in Figure
B.

Figure B - You'll see the output from the Memory Test tool appear in the Transfer Output window.
You'll notice that the report from MEMTEST.EXE implies
that the example program, WHELLO.EXE, uses the wrong form of the
delete() operator. In fact, it does use the wrong form,
which you can confirm by comparing lines 109 and 112 in the WHELLO.CPP
source file.
Instead of processing the MEMTEST.LOG file each time, you may be able to locate many allocation errors using the TRACE and WARN macros that we've embedded in the DEBUGNEW.CPP source file. Unfortunately, you won't be able to monitor memory leaks using these messages, and because these macros expand to become very large instructions, you may run into other problems as well.
For example, if your program is suffering from severe memory corruption,
is running out of space for static text, or isn't running
in a debugging environment that can store the TRACE and WARN messages,
you'll want to disable those messages when you use these
new() and delete() operators. To do so, simply
remove the lines
#define __TRACE
#define __WARN
from the beginning of the source file and recompile it. If you compile that version of the DEBUGNEW.CPP file with your program, it won't produce any debugging output except the MEMTEST.LOG file.
By the way, the first time you display TRACE or WARN messages
on your system, you'll receive a "Cannot Write to
Aux Device" error message. This error will go away after
you've run your application once.
Next month, we'll show how you can use CodeGuard, a new
debugging tool from Borland, to perform these types of dynamic
allocation tests and much more. CodeGuard is similar to other
memory utilities, but its integration with the IDE and with the
compiler itself sets it apart. (CodeGuard will actually change
the code that the compiler produces.)
Memory allocation problems are a significant source of errors
in C++ programming. While you can and should use third-party diagnostic
tools to monitor memory-related errors in your code, you can achieve
many of the same benefits by creating your own tool. In addition
to improving the quality of your code, you'll learn more
about C++ memory management.
Copyright (c) 1996 The Cobb Group, a division of Ziff-Davis Publishing Company. All rights reserved. Reproduction in whole or in part in any form or medium without express written permission of Ziff-Davis Publishing Company is prohibited. The Cobb Group and The Cobb Group logo are trademarks of Ziff-Davis Publishing Company.