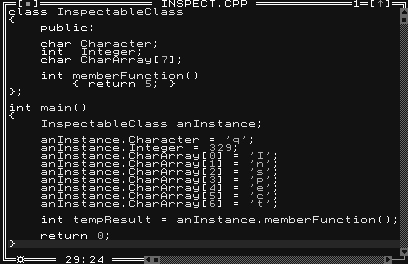
Figure A - When you specify a breakpoint in a source file, the IDE highlights the breakpoint line.

When you're debugging a procedural program, viewing and modifying a variable is relatively straightforward. However, viewing the status of an object in a C++ program can be more difficult.
Fortunately, you can open several kinds of inspector windows when you're debugging a program in the DOS Integrated Development Environment (IDE), which is part of Borland C++ 3.1. You can open ordinal, pointer, array, structure and union, function, constant, and class inspector windows.
You'll use class inspector windows to examine any of the data members for an instance of a given class or struct. You can then open other types of inspector windows to examine the individual data members of an object. In this article, we'll show you how to use class inspector windows to view the changing values of an object's data.
You can open a class inspector window in the IDE only when you've stopped a running program at a breakpoint. (A breakpoint is a location in the code you select as a temporary stopping point.) If you try to inspect something before running the program, there won't be a current symbol table and the debugger won't be able to identify the item you want to inspect.
When you've run the program to a breakpoint, you'll select the symbol for the object you want to examine. You can open inspector windows two ways: from the editor or from the Data Inspect dialog box.
To open an inspector window from the editor, highlight the symbol you want to examine in an edit window. After selecting the item, press [Alt][F4].
To open an inspector window from the Data Inspect dialog box, choose Inspect... from the Debug menu. When the Data Inspect dialog box appears, enter the symbol you want to inspect in the Inspect entry field and click the OK button.
When you open a class inspector window for an object, you can then open other types of inspector windows for each member of that class. To inspect a subitem, either press [Return] or double-click on the subitem itself.
If you want to inspect the name of a class or struct type instead of an individual object, you can view the organization of the class without displaying the current values of a particular instance. Viewing a class or struct with an inspector window is particularly helpful when you're using an unfamiliar type from a library.
To view the organization of a class or struct in an inspector window, specify the name of the type as if it were a symbol. When you open a class inspector window with a type, you can still view the individual members of the type, just as you can with an instance of the type.
To begin using class inspector windows, launch the Borland C++
DOS IDE. When the IDE Desktop appears, choose New from the File
menu and enter the code from Listing A in the editor window that
appears.
class InspectableClass
{
    public:


    char    Character;
    int     Integer;
    char    CharArray[7];


    int     memberFunction()
        { return 5; }
};


int main()
{
    InspectableClass anInstance;


    anInstance.Character = 'q';
    anInstance.Integer = 329;
    anInstance.CharArray[0] = 'I';
    anInstance.CharArray[1] = 'n';
    anInstance.CharArray[2] = 's';
    anInstance.CharArray[3] = 'p';
    anInstance.CharArray[4] = 'e';
    anInstance.CharArray[5] = 'c';
    anInstance.CharArray[6] = 't';


    int tempResult =
        anInstance.memberFunction();


    return 0;
}
Save this file by choosing Save from the File menu. When the Save File As dialog box appears, enter INSPECT.CPP in the Save File As entry field.
Next, click on the last line of the main() function. Choose Toggle Breakpoint from the Debug menu. This will force the program to stop at the end of this function before it closes. The IDE highlights the line you set the breakpoint on, as shown in Figure A.

Figure A - When you specify a breakpoint in a source file, the IDE highlights the breakpoint line.
Now, run the program to the new breakpoint by choosing Run from the Run menu. After the compiler creates a new executable file, the program will run and then stop at the last line of the main() function.
Select the symbol anInstance by double-clicking on it in the editor window. Open a class inspector window by pressing [Alt][F4]. When the class inspector window appears, you'll see the memory address anInstance. Below the object's address, you'll see the values of each of the data members, as shown in Figure B.

Figure B - Class inspector windows show the values of an object's data members.
Open a subitem inspector window for the data member Character by double-clicking on its name in the class inspector window for anInstance. When the ordinal inspector window for Character appears, you'll see the memory address of the data member itself.
Notice that since the data member Character is the first element declared in InspectableClass, its address is the same as the object's address. Figure C shows the inspector window for the data member Character.
![]()
Figure C - Subitem inspector windows show class members in more detail.
Open a subitem inspector window for the array member CharArray by clicking on its name and then pressing [Return]. When the Array inspector window for CharArray appears, you can see each element of the array, as shown in Figure D.

Figure D - You can view array elements from an Array inspector window.
Choose Run from the Run menu to allow the program to run to the end and return control to the IDE. Finally, close the editor window for the INSPECT.CPP example file by choosing Close from the IDE's Window menu.
The complex organization of class and struct members can make
debugging a C++ program very difficult. By using class inspector
windows, you can easily see the names and values of any object's
members. In addition, you can open inspector windows for any of
the members of a class to see more detailed information.
Copyright (c) 1996 The Cobb Group, a division of Ziff-Davis Publishing Company. All rights reserved. Reproduction in whole or in part in any form or medium without express written permission of Ziff-Davis Publishing Company is prohibited. The Cobb Group and The Cobb Group logo are trademarks of Ziff-Davis Publishing Company.