
ately, more and more users have become concerned about the size of their applications. Not only do larger applications take up more disk space, but they donít compare well with smaller applications. In many cases, users are looking more favorably on products that require less of their limited PC resources.
Unfortunately, debugging information can be one of the more significant culprits in increasing executable file size. The complexity of debugging object-oriented programs has forced the Borland C++ compiler family to add more detail to object filesí debug information during debugging builds. The linker eventually copies this debug information into the executable file.
However, you donít have to deliver to your customers applications that include this unnecessary debug data. In this article, weíll show you an easy way to remove the debugging information from executable files you create with Borland C++.
When you want to debug an application, you have to tell the compiler to include the appropriate debug information for either the integrated or standalone debugger. This debug information includes variable, function, and source file names, as well as other low-level data. As the compiler processes each source file, it embeds this debug data in the target object files, which the linker then copies into the executable file.
Fortunately, itís easy to eliminate the debug data from the application after you compile it. You can use the TDSTRIP utility to remove the debug data from the executable file and place the data in a separate symbol file. You can later use this symbol file to continue to debug or profile the ìstrippedî executable file.
After removing the debug data from the executable file, you can perform final testing. Now, letís build one of Borlandís example projects and see how much unnecessary debug information we can remove.
To begin, start the DOS version of the Integrated Development Environment (IDE) by entering BC at the DOS prompt. Weíll use the DOS compiler for this example because the target executable file is a simple DOS application. However, the technique we use here will work on either DOS or Windows applications.
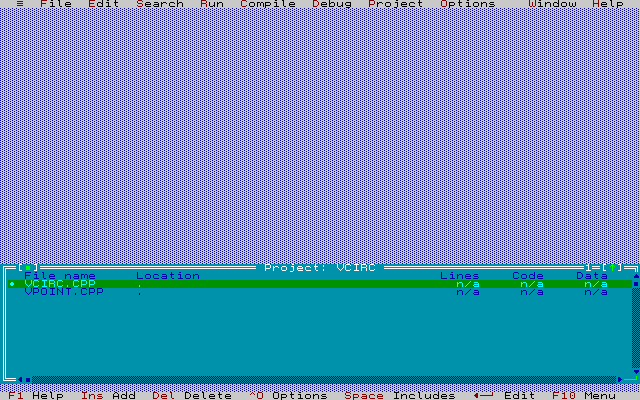
Choose Open from the Project menu, and then select the VCIRC.PRJ project from the \EXAMPLES directory. Figure A shows the VCIRC project window that appears after you select the OK button.
Figure A - The VCIRC project window displays the name of each source file.

Before setting any of the other options, youíll first need to specify the application type. To specify that this project will create a DOS executable file, choose Application**ellipsis** from the Options menu. When the Set Application Options dialog box appears, click the DOS Standard button. When the Set Application Options dialog box matches the one shown in Figure B, select the OK button to save the settings.
Figure B - You set the application type from the Set Application Options dialog box.

Now, tell the compiler to include debugging information by choosing Debugger**ellipsis** from the Options menu to display the Debugger dialog box. Select the On radio button in the Source Debugging group, as shown in Figure C, and then click the OK button to save the debugger options.

Figure C - Turn on source-level debugging from the Debugger dialog box.
Next, build the debug version of VCIRC by choosing Build All from the Compile menu. When the compiler finishes compiling the VCIRC project, the status window should resemble the one shown in Figure D.

Figure D - The status window displays detailed information about your project.
To check the size of your executable file, first exit the IDE
and return to DOS by choosing Exit from the File menu. Then, in
the \EXAMPLES directory, check the size of VCIRC.EXE by entering
dir vcirc.exe
The directory listing should display the size of VCIRC.EXE as 35,209 bytes.
Now, run the TDSTRIP utility on this file by entering
\borlandc\bin\tdstrip -s vcirc.exe
After TDSTRIP finishes removing the debug information from the
executable file, you can check the size of the executable file
again by entering
dir vcirc.exe
As Table A shows, the executable file size should be 26,832 bytes, or about 76 percent of the original size!
TABLE A - Using TDSTRIP on an executable file can dramatically reduce its size.
| Executable File Size (in bytes) | |
| Compiled with debug | After running TDSTRIP |
| 35,209 | 26,832 |
In the example, the actual number of bytes saved may seem trivial. However, larger programs will frequently have a proportionally larger amount of debug information and will therefore benefit even more from stripping out the debug data.
If you tell the compiler to include debugging data when you compile, the linker will transfer this data to the EXE file by default. While debug data is necessary during the development of an application, it can add a significant number of bytes to the size of your executable file.
By using the TDSTRIP utility we demonstrated in this article,
you can convert your debug executable files to final form without
recompiling. By shipping smaller, leaner applications, you can
reduce the disk space requirements your applications place on
your customersí systems.
Copyright (c) 1996 The Cobb Group, a division of Ziff-Davis Publishing Company. All rights reserved. Reproduction in whole or in part in any form or medium without express written permission of Ziff-Davis Publishing Company is prohibited. The Cobb Group and The Cobb Group logo are trademarks of Ziff-Davis Publishing Company.