You can use the Microsoft Visual InterDev debugger to test scripts written in Microsoft Visual Basic Scripting Edition (VBScript) and Microsoft JScript. Debugging Web pages can be different than debugging in traditional development environments in these ways:
The Visual InterDev debugger allows you to debug in all of these scenarios. You can debug client script running in your local version of Internet Explorer.
Note It is highly recommended that you do not use Active Desktop mode of Internet Explorer 4.0 when you are debugging.
To debug script running in Microsoft Internet Information Server (IIS) 4.0, you can run the debugger on your computer and attach it to a script running on the server. If the server is running on another computer, you can use remote debugging to debug script running there.
Note For information about debugging Java components on your Web page, see the Java documentation on debugging.
Debugging is about finding errors. When you work with script, you might encounter the following types of errors that require debugging:
Note In some programming environments, syntax errors are referred to as pre-processor, compilation, or compile-time errors.
The basic process of debugging scripts consists of these tasks:
Note You can't work with the debugger in Design view or Quick view of the HTML editor. To debug, switch to Source view.
To allow you to perform these tasks, the debugger includes these commands and windows:
To set and change values, you use the Immediate window. You can evaluate any expression in the window and can enter script commands and see their effect. You can also view and change values in the Watch window.
Understanding how client scripts are processed and how errors are handled can help you debug client scripts successfully.
Client script is processed by Microsoft Internet Explorer. The browser calls the appropriate runtime module to process VBScript scripts or JavaScript scripts.
Client scripts are initially parsed when the Web document is loaded into the browser. During this parsing phase, the browser reports any syntax errors that it finds.
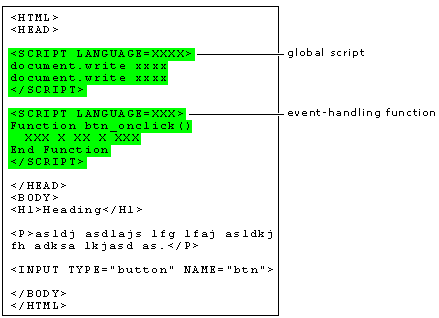
After parsing a section of script, the browser executes it. Global or inline scripts, which are scripts that are not part of an event-handling subroutine or function, are executed immediately. Event-handling subroutines or functions, and procedures that are called by other procedures, are parsed immediately but are not executed until triggered by an event or called by another procedure.
Client script processing

If a run-time error occurs when a client script is executed, an error message is displayed and the script containing the error stops. Other client scripts in the document can still run (unless you use start the debugger). If the script containing the error is called again, the error message is displayed again.
Depending on the language you are using, you might be able to include statements in your scripts to trap runtime errors and run your own error procedures. For example, in VBScript, you can use the ON ERROR statement to establish error trapping. For more details, see the documentation for your scripting language.
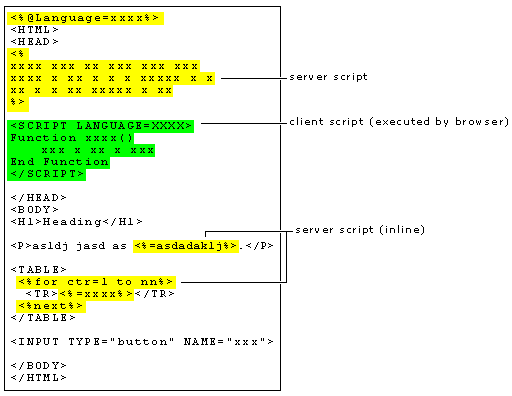
Most server script is not event-driven. Instead, when an .asp file is requested, the server reads the page and processes all server script from top to bottom. This includes script that is inline with HTML text, as shown in the following diagram.
Server script processing

Not all server script is executed immediately. As with client script, server script can include functions and subroutines that are executed only when they are called from other procedures.
Global.asa files are a special case. The Application_OnStart and Session_OnStart procedures in these files are executed only once for an application and for a session. Therefore, to debug these events easily, you must embed debugging statements in the file. For details, see Debugging a Global.asa File.
In addition to debugging scripts and processes that are running on your computer, you can debug those that are running on another computer. This is referred to as remote debugging. In Microsoft Visual InterDev, remote debugging is useful for debugging server scripts running in ASP pages on Microsoft Internet Information Server (IIS).
Ordinarily, to debug a server script in an ASP page, you would have to install Visual InterDev on the server and then debug scripts locally on that server. However, with remote debugging, you can attach the debugger running on your computer to a script running on the server and issue debugging commands across the network.
Note If IIS and Visual InterDev are running on the same computer, you can debug server scripts without remote debugging.
For the most part, remote debugging is similar to debugging locally, except for these differences:
The information below explains how to set up remote debugging, and then how to establish a remote debugging session.
Remote debugging uses distributed COM (DCOM) to communicate between the client and server computers. You must therefore configure DCOM to allow a remote user to attach the debugger to a process there.
Note To use remote debugging, you must have installed Microsoft Internet Information Server (IIS) 4.0 and configured it for remote debugging. You can do this from the server setup portion of the Visual InterDev installation process.
To configure DCOM for remote debugging
IIS applications must also be configured correctly so that they can be debugged remotely, but Visual InterDev does this automatically when you start debugging a project that uses remote debugging. Specifically, Visual InterDev:
After configuring the server for remote debugging, you can debug on the server in much the same way you do locally.
Note It is highly recommended that you do not use Active Desktop mode of Internet Explorer 4.0 when you are debugging.
There are two ways to start remote debugging:
If you launch a project using the debugger, you can start debugging at the first line of script. Otherwise, you will only be able to debug script that runs after you attach to the process. In addition, if you launch a project, you will be able to edit the files you are debugging. When you attach to a process, you can see the files you are debugging, but cannot edit them there.
Note Because remote debugging ties up process threads on the server, it is recommended that while a remote debugging session is in progress, other users avoid using the server.
If you want to launch a project using the debugger, you must make sure first that debugging is enabled for ASP pages.
To enable remote debugging in ASP pages
After enabling remote debugging, you can launch the debugger.
To launch a project using the debugger
Visual InterDev starts the project and automatically attaches the debugger to the remote page. If another user is already debugging, Visual InterDev displays an error message.
Note The first page displayed will be the project's start page, which is not necessarily the page you were editing when you launched the project.
If you detect an error while the application is running, you can attach the debugger to it.
To attach to a running process
The process you selected appears in the Debugged Processes list.
You can step through scripts and test variables and expressions normally. However, to run a page you must navigate to it in your browser. In addition, you cannot edit the pages that you are debugging.
Visual InterDev includes a SQL debugger that you can use to debug Microsoft SQL Server stored procedures and triggers in much the same way that you debug other kinds of scripts or programs.
Before debugging stored procedures and triggers in Visual InterDev, you must set up both SQL Server and Visual InterDev properly by:
Unlike debugging other types of processes, you don't debug stored procedures or triggers while they are running. Instead, you open the procedure in the editor and debug it from there.
To debug a stored procedure
The editor window opens with the stored procedure text in it and the debugging commands enabled on the Debug menu.
After you've opened the editor window in Debug mode, you can use debugger commands as usual. For example, you can set breakpoints and step through the procedure. You can view the values of variables and passed parameters in the Locals window. You can also drag expressions to the Watch window to track them as you step through or run the procedure. The results of SQL PRINT statements are displayed in the Output window.
However, the SQL debugger has the following differences from the debugger used for script:
If you are working with simple SELECT statements ù ones that return only a single value ù the return value is in a variable that you can inspect in the Locals window. However, if the SELECT statement returns a result set, it is not displayed in the debugger. Instead, you can view the result set in the Output window.