Activity tab
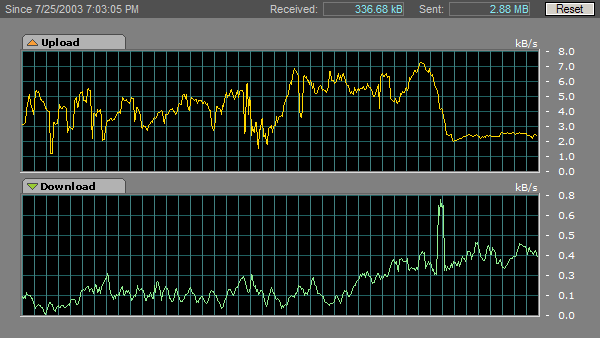
This tab displays current internet activity of the selected node. There are
two charts. First one shows upload activity and second download activity.
You can hide or show each of these charts by checking or unchecking the check
buttons in the Property window (on the left from Info view).
Properties
There are three more options for 'Activity' tab in the Property window:
- Auto Zoom
-
Check this option (recommended), if you want to scale the chart grid according
to maximum of the transfer rate. If it is not checked, the chart is scaled
accordfing to the line speed set on the top property window.
- Chart Height
-
-
Value in % sets how much of the height of the grid is used for the chart.
- Chart
Type
-
Select from three types of the chart. æRaw dataÆ displays amount of transfered
data during the last several hundereds seconds. æTransfer rateÆ displays
transfer rate trends for the selected node. There is a third option named
æBothÆ. This is a combination of previous two options.
Counter Bar
On the top of the Activity tab there is a counter bar. It shows an
amount of received and sent data for the selected node since the NetLimiter has
started or since the user had reseted the counter with the Reset
button. The Start time is displayed on left side of the counter bar.