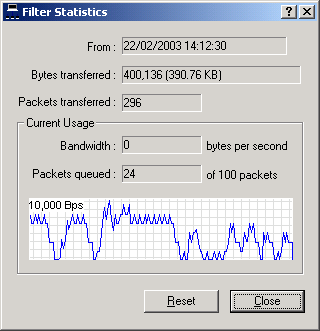
The statistics window shows information about a particular filter. Various statistics are displayed, including the amount of traffic which has been filtered and the current usage.
The statistics window is refreshed only twice per second so as not to create too much load on the system.
Below is an image and a description of the statistics window:

From
This is the date and time from which statistics gathering began. It is
either the time that the filter was created or when the statistics were last
reset.
Bytes transferred
This is the number of bytes which have passed through the filter. If
it is a 'send' filter then it is the number of bytes sent, otherwise it is the
number of bytes received.
Note: 1 kilobyte (KB) is defined here as 1024 bytes. 1 megabyte (MB) is defined as 1,048,576 bytes. 1 gigabyte (GB) is defined as 1,000,000,000 bytes.
Packets transferred
This is the number of packets which have passed through the filter. If
it is a 'send' filter then it is the number of packets sent, otherwise it is the
number of packets received.
Current usage - Bandwidth
This is the number of bytes per second that are currently being used by the
filter.
Current usage - Packets queued
Each filter contains a queue which is used to hold traffic that arrives too
fast for the filter to handle. Each queue holds up to 100 packets (each
packet is usually 1400 bytes). If the queue fills up to this limit of 100
packets, then it has no choice but to start dropping packets as there is no
space left. This should cause no problem for applications, however, as
most will built to handle packet loss.
Large queues can cause latency, however. This is because when a packet arrives at the end of a long queue, it must wait until all packets in front of it are sent before it gets a chance to be sent. The latency depends on both the current queue usage and the speed of the filter. Therefore it is recommended that for applications that demand low latency (online games, IP telephony), the rate should not be set too low.
Usage history graph
This shows the recent bandwidth usage. The blue line is the number of
bytes per second that are being used by the filter at a specific point in time.
The vertical scale of the graph is denoted by the value at the the top left of the graph. This number changes as the graph grows and shrinks so that maximum detail can be viewed.
Reset
Clicking this button resets the statistics for the filter. This will
not disturb network traffic that is flowing through the filter.
Statistics are not reset when the system is shut down.