Sound Analysis
Acoustica features a range of tools that allows you to study your
recorded material in the time domain, frequency domain or a combination
of these. Don't freak out, the terms frequency and time domain are
explained below.
The Time Domain
The normal wave plot shown when making a recording in Acoustica is
a time domain representation of the signal. When recording, Acoustica has
taken samples of the signal at certain intervals, quantisized them,
and stored
them as series of digitized values. The wave plot is the
result of drawing these samples on the screen with the time
evolving along the horizontal axis.
Figure 1. A plot of a signal represented in the time domain.
The Frequency Domain
All natural sounds can be described as an infinite sum of sine
functions. The frequency of a sine function is related to
what we sense as pitch. Fortunately enough are our ears not able
to hear frequencies above 20kHz (a sine function with 20 thousand
completed wavelengths within one second), so the mentioned infinite
sum turns into a finite sum which is possible to handle on a computer.
The signal in the frequency domain is represented through the weight
of each sine function needed to recreate the signal, rather than
the sampled values from the time series. These weights are
visualized in Acoustica by selecting Analysis | Spectrum Analyzer.
Figure 2. A plot of a signal represented in the frequency domain.
So until now we have a tool for examining the frequency content of
our recording and we have the normal wave plots for examining how
our recording evolves over time. Is there a possibility to combine
these features. Under certain conditions (amazingly enough these
conditions relates Heisenberg´s in physics famous law
of uncertainty, for those of you remembering your physics class
at school), the answer is yes.
Acoustica features to ways of displaying time-frequency plots.
The spectrogram and the wavelet transform (based on the Morlet
class of wavelets for the advanced reader). The differ mainly
in the way linear way of representing frequency of the
spectrogram and the logarithmic representation of the wavelet
transform.
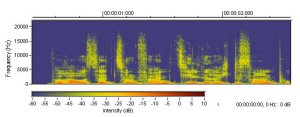
Figure 3. A time-frequency plot. The vertical axis represents
the frequency, the horizontal represents time.