 Main Menu: Image > Adjust/Histogram
Shortcut: Ctrl-H
Adjustable Histogram
Main Menu: Image > Adjust/Histogram
Shortcut: Ctrl-H
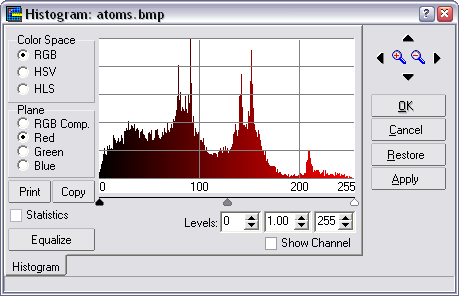
The Histogram is a graph that displays the frequency distribution of the different image channels, depending on the Color Space selected (when the image is grayscale, the Color Space pane will not be visible:
For each Color space it is possible to show any of its different planes by selecting it in the Plane pane.
The histogram describes, in a graphic form, the contrast and dynamic-range characteristics of the image. A histogram is displayed as a two-dimensional graph. The horizontal axis represents the lightness values of the image from black (value 0) to white (value 255, for RGB Color Space; other color spaces show different scales). The vertical axis indicates the number of pixels at each value. In general, the histogram gives a clue as to what contrast enhancements will improve the image. At a lightness level where there are many pixels of one of the values, the corresponding line spikes; where there are few pixels, it appears close to the horizontal axis. In dark images, most of the pixels are grouped at the left side. If an image is too light, the pixels are grouped at the right.
Both the equalization handlers, the Levels text boxes, the Equalize button and the Statistics check box only will work when selecting RGB as Color space.
Because not always the pixels in an image cover all brightness range, by stretching the pixels values to the full range, the image contrast may be improved.
An image histogram can be stretched in two ways:
Manually, by dragging the equalization handlers over the image (see next topic below for more information about that).
Automatically, by clicking on Equalize button, to distribute the lightness values of the pixels more evenly across the light spectrum from black to white. Equalize makes the darkest pixel as close to black and the lightest pixel as close to white as possible and distributes the remaining pixels evenly between these two values. This produces an averaging, or tempering, of the brightness in the image.
Equalization Handlers ![]()
The ![]() low value,
low value, ![]() gamma and
gamma and
![]() high value equalization handlers, below the histogram,
are used to adjust the tonal range and color balance of an image by adjusting
intensity levels of the image's shadows (
high value equalization handlers, below the histogram,
are used to adjust the tonal range and color balance of an image by adjusting
intensity levels of the image's shadows (![]() ), midtones (
), midtones (![]() ), and highlights (
), and highlights (![]() ).
).
To adjust the shadows and highlights manually drag the ![]() and
and ![]() equalization handlers to the edge of
the first group of pixels on either end of the histogram.
equalization handlers to the edge of
the first group of pixels on either end of the histogram.
If your image needs midtone corrections, use the ![]() gamma handler to
correct them. Moving the gamma handler to the left makes the overall image
lighter. It maps a lower (darker) level up to the midpoint level between
the other two equalization handlers. If the low
gamma handler to
correct them. Moving the gamma handler to the left makes the overall image
lighter. It maps a lower (darker) level up to the midpoint level between
the other two equalization handlers. If the low ![]() and high
and high
![]() handlers are in their default position (0 and 255), the
midpoint would be level 128. In this example, the shadows expand to fill
the tonal range from 0 to 128 and the highlights get compressed. Moving
the gamma handler to the right has the opposite effect, making the image
darker.
handlers are in their default position (0 and 255), the
midpoint would be level 128. In this example, the shadows expand to fill
the tonal range from 0 to 128 and the highlights get compressed. Moving
the gamma handler to the right has the opposite effect, making the image
darker.
The low, midpoint and high points can be also set by using the Levels text boxes, instead dragging the equalization handlers.
Show Channel: This option only is available when selecting a single plane, not when selecting RGB Comp., and it displays only the selected plane in the image window, instead the composite image. By clicking OK or Apply the image will be replaced for the selected channel.
Statistics: Shows the statistics for the histogram.
Print: Prints, either the histograms for all channels or the image channels.
Copy: Copies the histogram to the Windows clipboard.