|
|
|
|
Filtering Terrains
Filtering is the process of adjusting the grayscale curve of your Terrain Canvas. By adjusting the grayscale curve, you create a custom elevation effect.
How Filtering Works
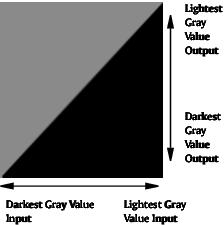
The Filter area is essentially a graph that represents gray level input from black to white horizontally, and gray level output from black to white vertically.
The Filtering graph expresses all the input and output gray values in your Terrain Canvas.
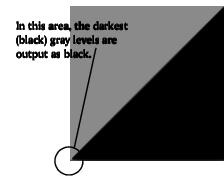
The default diagonal filter creates a graph where all values input as black are also output as black, and all values input as white are also output as white. That is why your Terrain Canvas appears unchanged-none of its gray level values have been altered.
By dragging in this Filter area, you can remap the gray values in your Terrain Canvas.
To see how filtering works:
1 Place your cursor (which changes to a Pen within the Filtering area) in the top left corner of the Filter Area.
2 Drag diagonally to the bottom right corner.
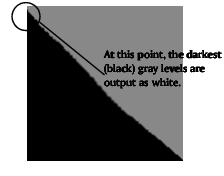
As you can see in the Preview area, your Terrain Canvas is inverted.
The original graph showed that all values input as black were output as black and all the values input as white were output as white.
In the original Filtering graph all values input as black are output as black and all values input as white are output as white.
The new graph you created now shows that all values input as black are output as white and all the values input as white are now output as black. In other words all the dark values are light and all the light values are dark.
In the new Filtering graph all values input at 0 are output at 255 and all values input at 255 are output at 0.
This is a drastic example. In most cases you would adjust more selectively, like lightening the midtone grays or darkening specific gray values. Remember that this graph represents your Terrain Canvas, so you're changing the shape of your terrain object as you adjust gray values.
The Filtering Tab
The Filtering tab is divided into three areas: the Filtering Graph, the Preview area, and the Filtering Presets.
The Filtering graph displays your Terrain Canvas's gray levels as value inputs and outputs. You can edit this graph to adjust the gray level values in your canvas.
Next to the graph is the Preview area. This area shows you what your Terrain Canvas would look like if applied to the current Filtering graph.This area automatically updates as you make changes to the graph.
Along the top of the tab are the nine Filtering presets you can apply to the graph. Each preset represents a different predefined graph. They are designed to create specific changes in gray levels, like smooth gradients and abrupt transitions.
Working in the Filtering Tab
Altering the Filtering Graph
The best way to start adjusting the Filtering graph is to determine the type of effect you want to create. For example, if your canvas is too dark, raise the value of the darker gray value inputs by drawing a ridge in the left side of the graph.
To alter the Filtering graph:
2 Drag your pointer over the area of the Filtering graph you want to adjust.
When you drag over a black area, the pencil draws in gray; dragging over a gray area draws in black.
Tracing over any lines you've drawn erases them.
To undo all changes to the Filtering graph:
2 Click the Reset text button below the Filtering graph.
The graph returns to the default Filtering graph.
To soften harsh transitions in the graph:
2 Click the Smooth text button below the Filtering graph.
3 Click the Smooth button again to soften the transitions more.
Applying Presets
Filtering presets are provided to help you get started adjusting the Filtering graph. These presets are designed to provide different effects. The best way to understand these presets is to apply them to your graph and see what happens.
To apply presets:
2 Click one of the preset buttons along the top of the tab. The current graph is replaced with the preset graph.
Applying Filtering Changes to Your Terrain Canvas
Although any changes you make to the graph are applied to the Preview area, they do not automatically affect your Terrain Canvas. You have to apply the changes before they affect the canvas.
You can temporarily apply your changes to the 3D Preview in real-time by holding down Control/Ctrl as you click and drag over the Filtering graph.
To apply the Filtering graph to the 3D Preview:
When you release the mouse the 3D Preview switches back to the unfiltered terrain.
To apply filtering changes to the Terrain Canvas:
Blending the Filtering Graph With the Terrain Canvas
The Filtering Tab offers several ways of applying your Filtering graph to the Terrain Canvas. You can apply the graph directly or you can blend the graph with the canvas.
When you use a blending option you're essentially drawing a grayscale gradient and then blending it with your original canvas.
To blend the Filtering graph with the Terrain Canvas:
1 Adjust the Filtering graph to achieve the desired effect.
2 Click the triangle icon below the Filtering graph and choose an option from the menu:
- Horizontal horizontally blends your Filtering graph, expressed as a grayscale gradient, with your Terrain Canvas.
- Vertical vertically blends your Filtering graph, expressed as a grayscale gradient, with your Terrain Canvas.
- Horizontal Add horizontally blends your Filtering graph, expressed as a grayscale gradient, with your Terrain Canvas.
This option uses a slightly different algorithm than the previous Horizontal option: it's not a traditional Additive, but an average of the existing terrain grayscale values with the maximum of the Terrain and Filter values.- Vertical Add vertically blends your Filtering graph, expressed as a grayscale gradient, with your Terrain Canvas.
This option uses a slightly different algorithm than the previous Vertical option: it's not a traditional Additive, but an average of the existing terrain grayscale values with the maximum of the Terrain and Filter values.
 Corel Corporation http://www.corel.com Voice: (800) 772-6735 Fax: (716) 447-7366 www.corel.com/support |