Main toolbar > Open Track View
Graph Editors menu > Track View > Open Track View
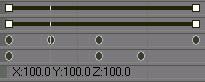
The Track View Edit window displays tracks and function curves. You select and change animation values and timing in this window. The Edit window also indicates the active time segment. Time within the active time segment is highlighted with a light gray background.
Interface
Tracks
Every item in the Track View Hierarchy has a track that displays what happens to the item over time.
There are two types of tracks.
Range tracks indicate when items below the track are animated. A range bar in the track displays the range of time over which the animation occurs.
Animation tracks contain the actual animated values for an item. These values are usually represented as keys
Keys
Whenever you change a parameter with the Animate button on, you create a key at the current time in that parameter's track. Keys are normally displayed in their track as dots, but they can also be displayed as ranges and vertices on a function curve.
Range Bars
When animation keys have been created, range bars display to indicate the range of time the animation occurs. Ranges always appear in range tracks, but in some display modes and certain controllers, animation tracks also display ranges.
Function Curves
Function Curves display the values of keys, and the interpolated values between keys as a curve. These curves express how a parameter varies over time. Only animation tracks can display function curves.
Time Ruler
The time ruler measures time. Markings on the ruler reflect the settings in the Time Configuration dialog.
Current time line
The current time set by the time slider is shown as a dark vertical line running through the edit window. Dragging the time slider moves the current time line.